Wonderful Wednesdays April 2022
The data reflects a phase III study - active vs placebo and the endpoint was Ordinal Scale for Improvement (OSCI). All patients started at OSCI=4 and daily measures over 35 days were performed. The challenge was to describe the treatment effect specifically taking into account the number and timing of patients who died, left the hospital or fully recovered.
COVID OSCI over time
As described above, the challenge was to describe the treatment effect specifically taking into account the number and timing of patients who died, left the hospital or fully recovered.
Example 1. Lasagna plots
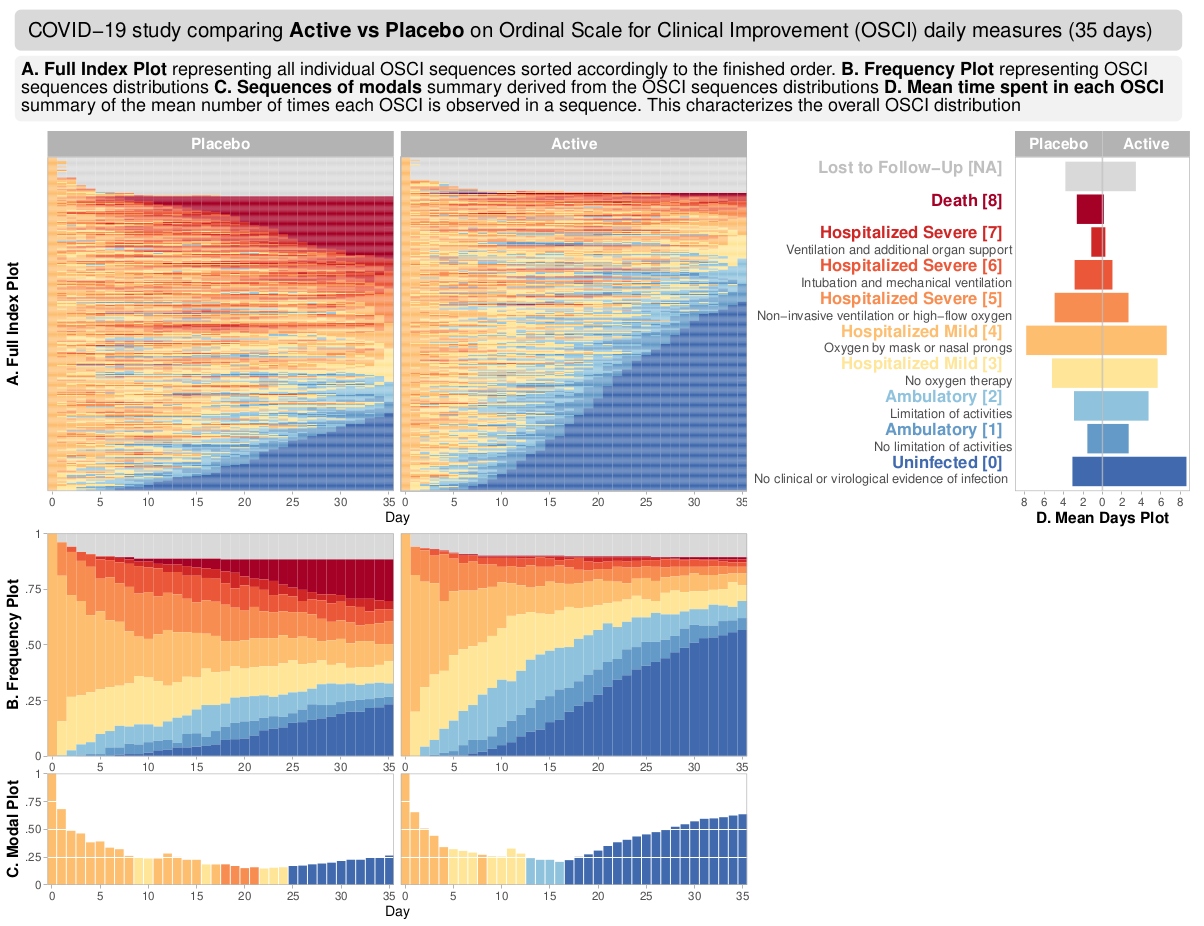
high resolution image
(A summary of the discussion will be added shortly.)
link to code
Example 2. Barcharts
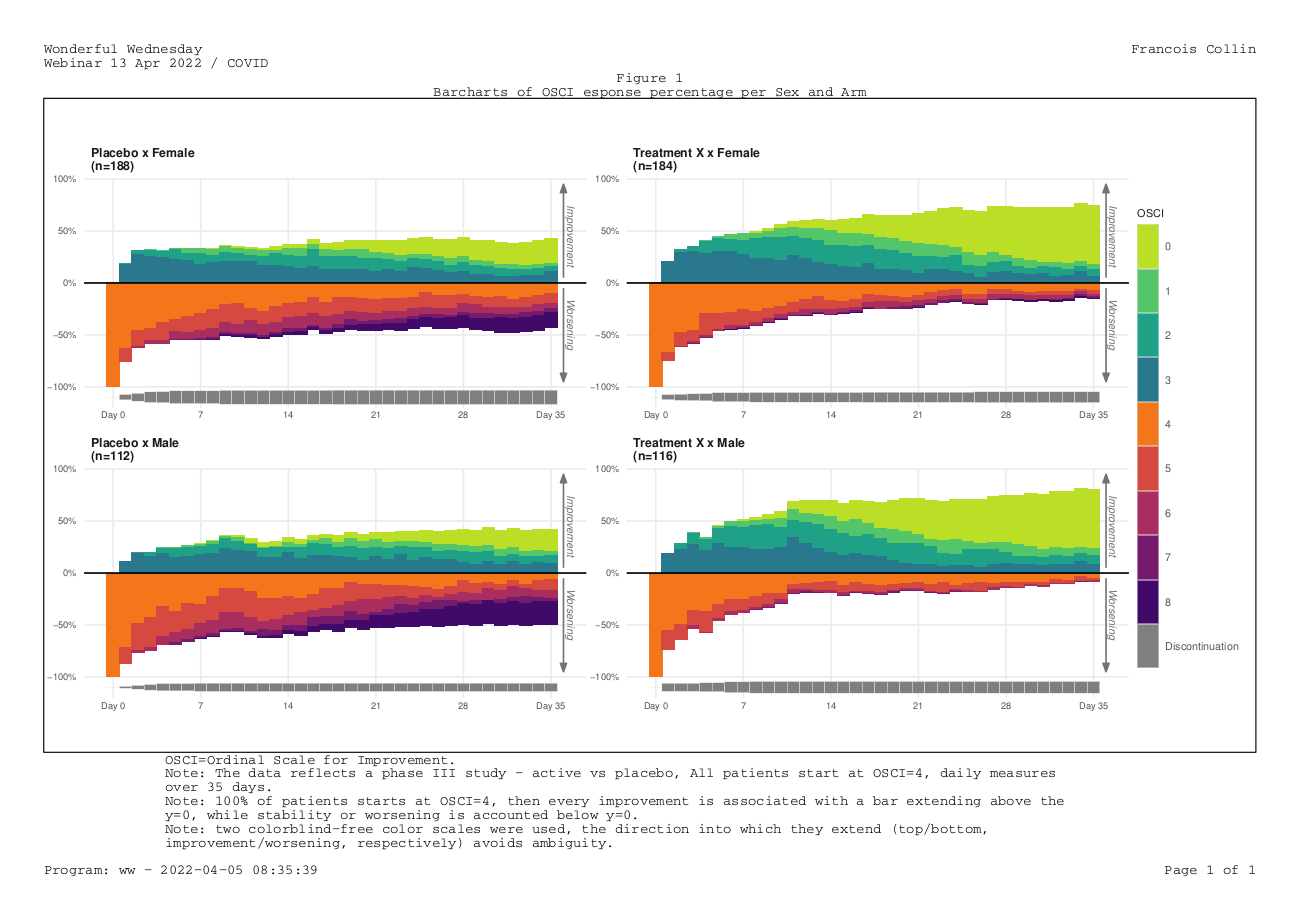
high resolution image
(A summary of the discussion will be added shortly.)
link to code
Example 3. Shiny app
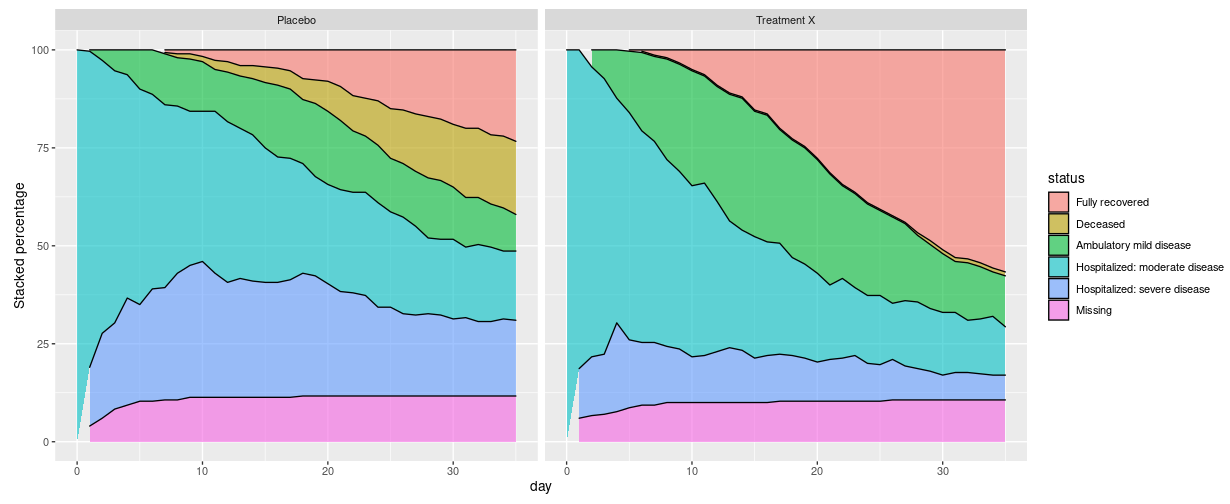
The shiny app can be found here
(A summary of the discussion will be added shortly.)
link to code
Code
Example 1. Lasagna plots
All code & reshaped data to reproduce this example can be found at: https://github.com/agstn/WW/tree/main/2022-03-09
Any questions let me know, Agustin Calatroni acalatroni@gmail.com
Back to blog
Example 2. Barcharts
No code has been submitted.
Back to blog
Example 3. Shiny app
No code has been submitted.
Back to blog
Citation
For attribution, please cite this work as
SIG (2022, April 13). VIS-SIG Blog: Wonderful Wednesdays April 2022. Retrieved from https://graphicsprinciples.github.io/posts/2022-04-30-wonderful-wednesdays-april-2022/
BibTeX citation
@misc{sig2022wonderful,
  author = {SIG, PSI VIS},
  title = {VIS-SIG Blog: Wonderful Wednesdays April 2022},
  url = {https://graphicsprinciples.github.io/posts/2022-04-30-wonderful-wednesdays-april-2022/},
  year = {2022}
}