Treatment Attributes
The background
The current challenge considers a hypothetical measure, the “Complete Disease Index” (CDI). The measure consists of five domains, each scored on a visual analogue scale from 0-100 (0=worst possible outcome, 100=best possible outcome). The simulated data reflects a trial where 500 participants, randomized at random to one of five treatment arms, score each CDI domain at Baseline and two follow-up visits (after 6 and 12 months).
The challenge
The challenge is to compare the relative performance of the treatments across the individual domains and overall, considering how this might change depending on the importance that subjects place on each domain.
Visualisations
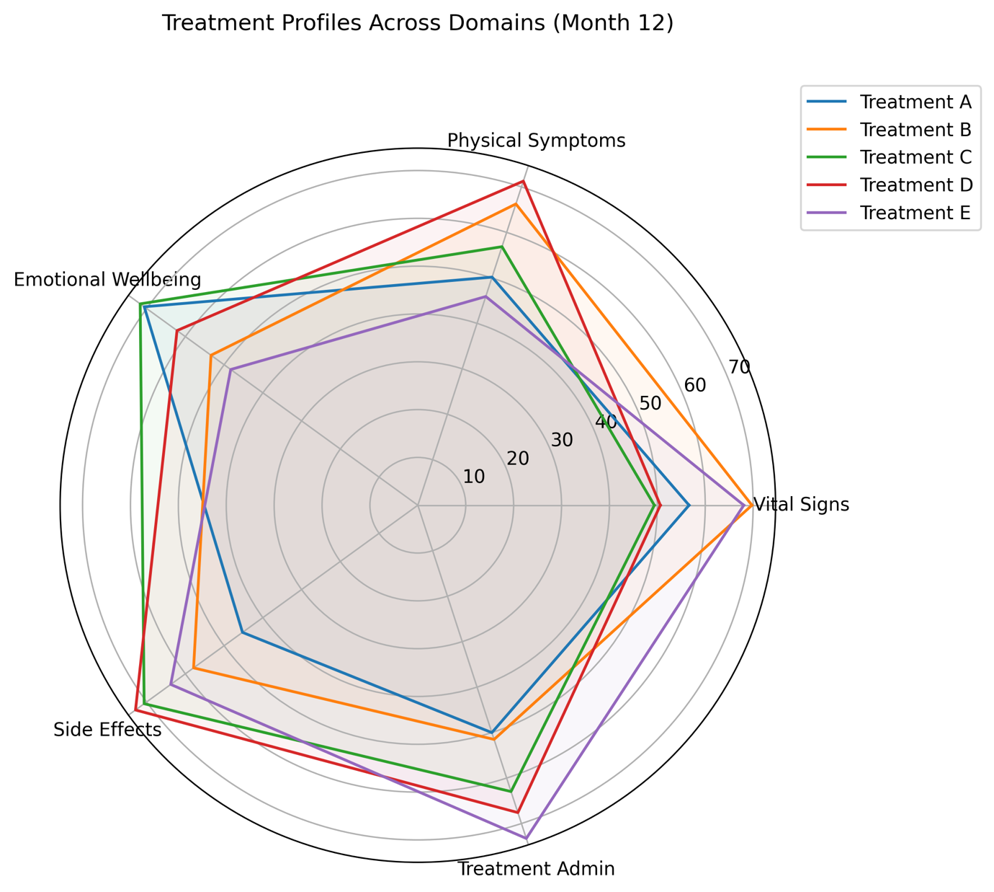
Example 1: Radar Chart
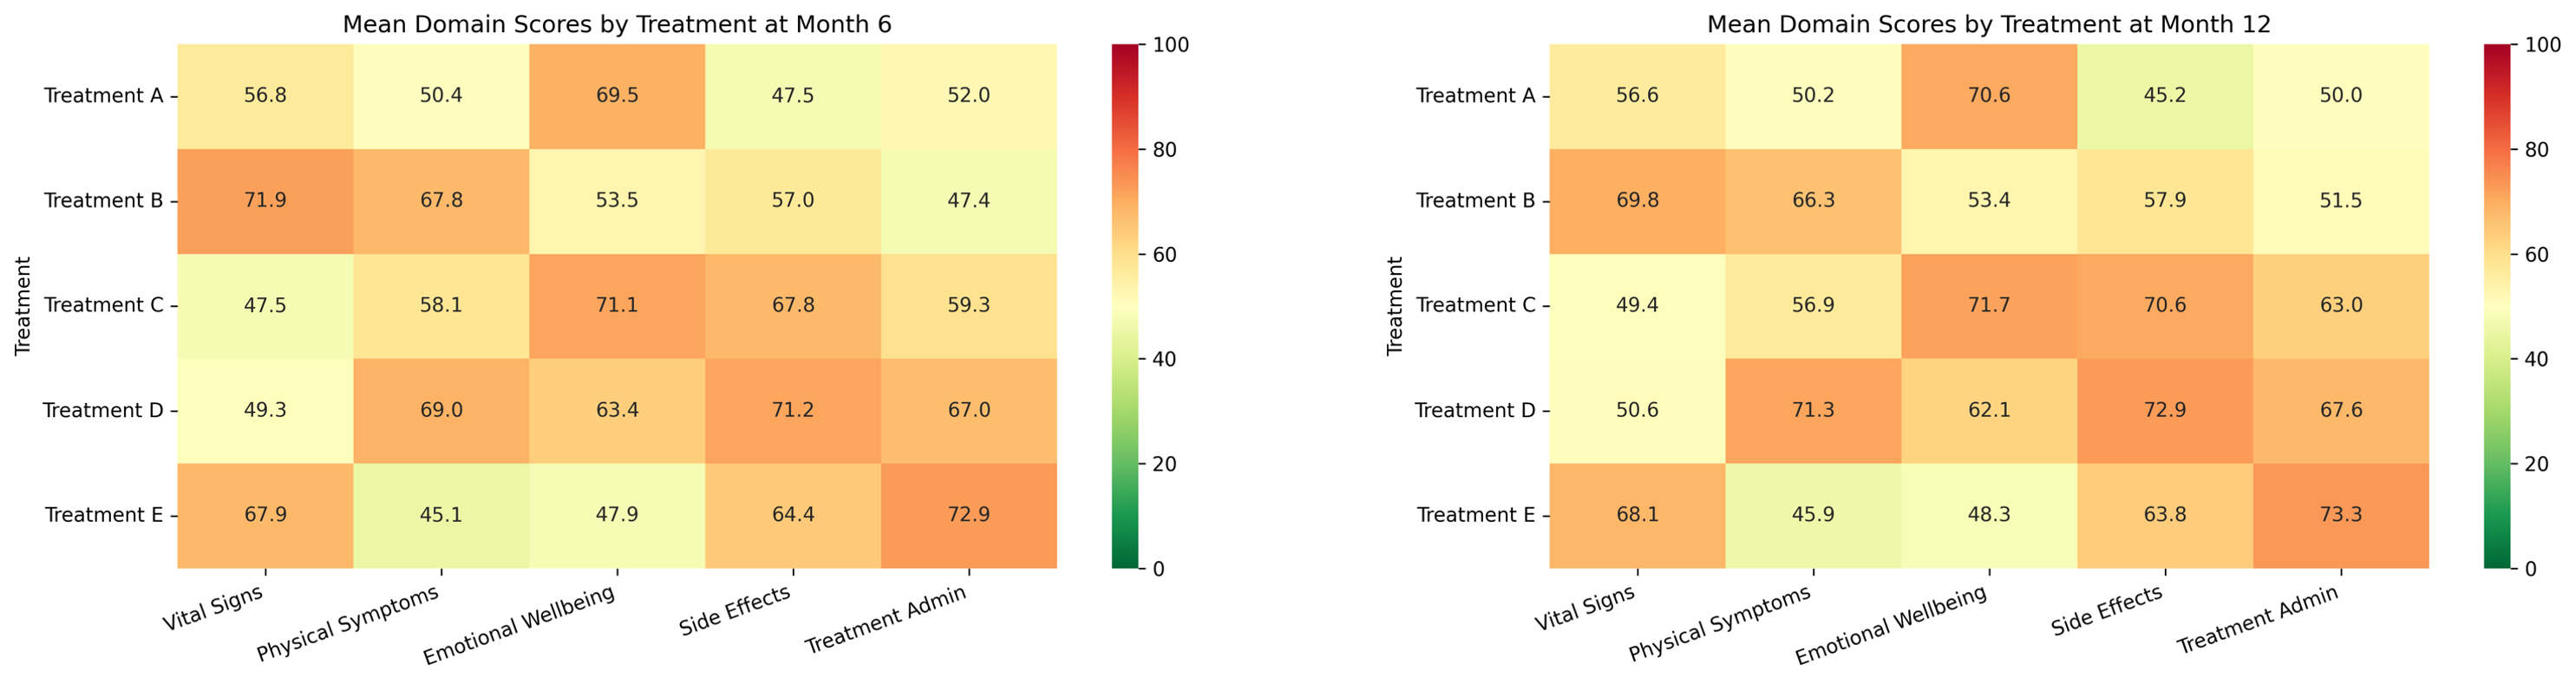
Example 2: Heatmaps by Domain
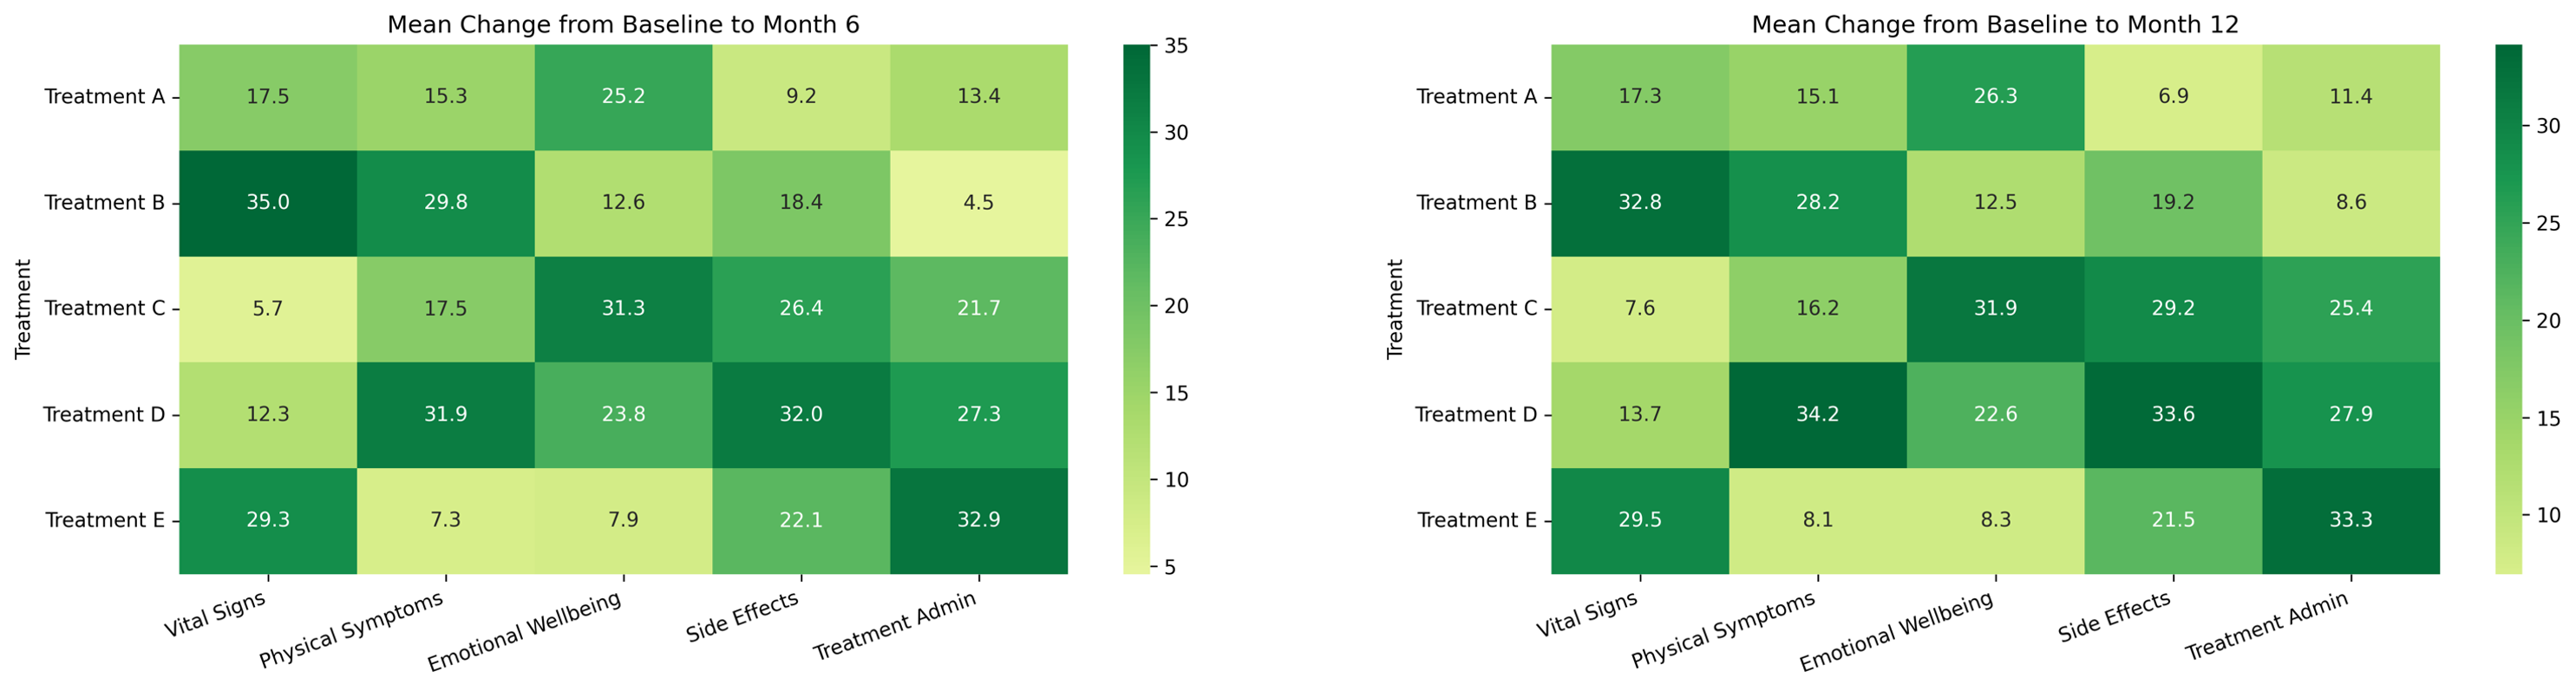
Example 3: Mean Change Heatmaps
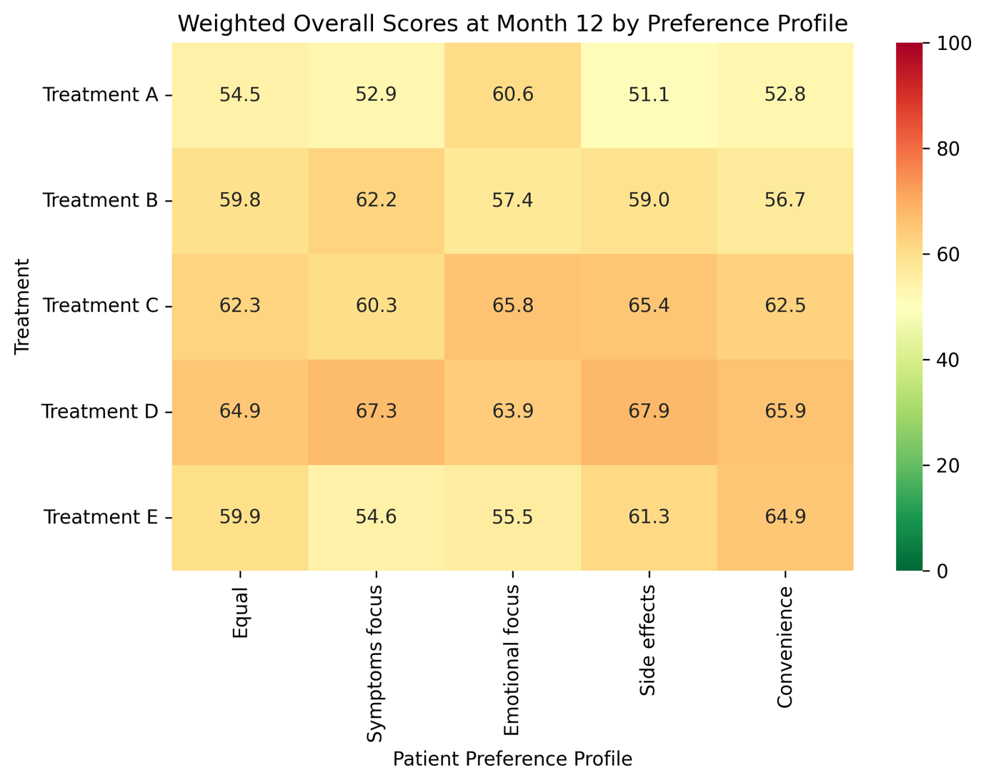
Example 4: Weighted Heatmap
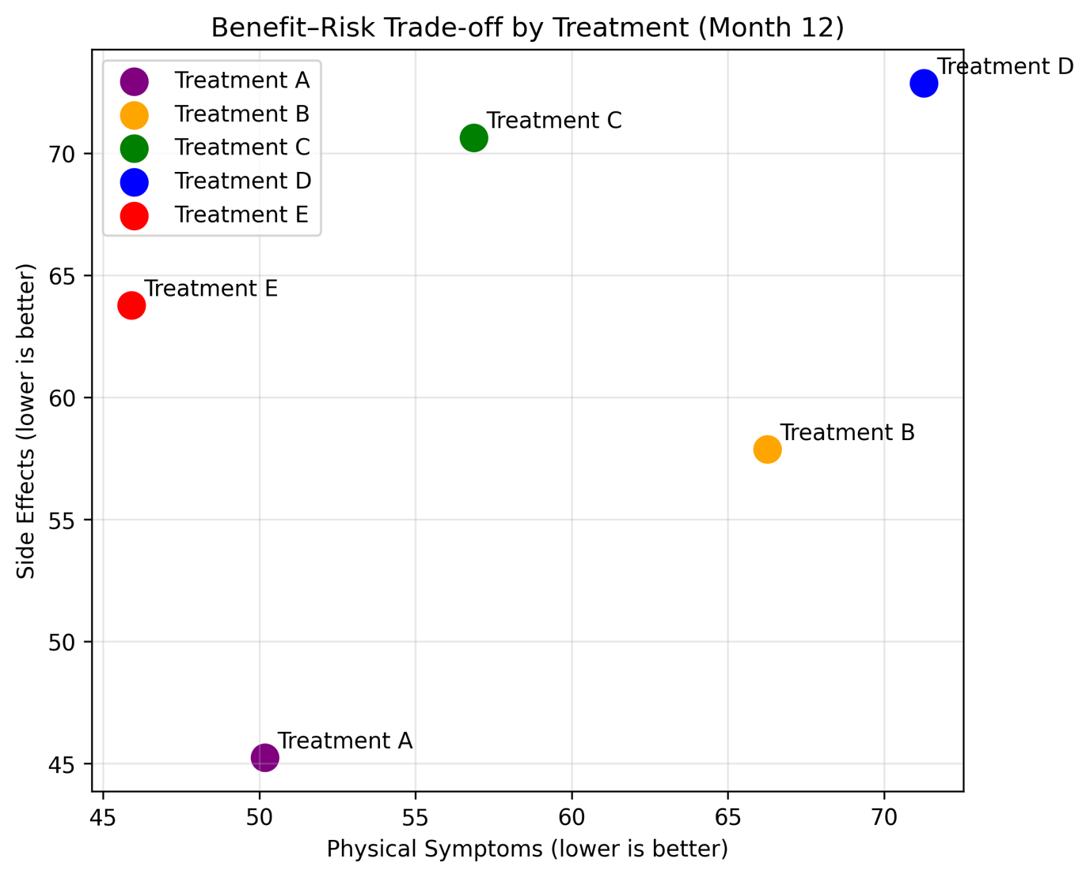
Example 5: Benefit-Risk Trade-Off
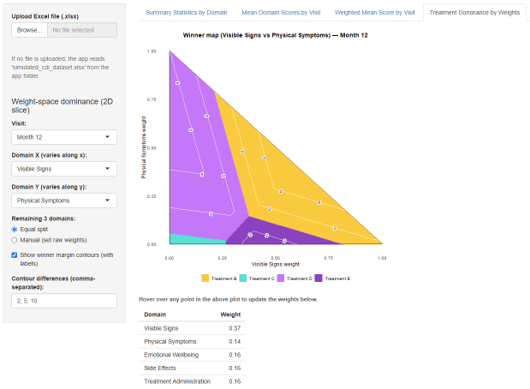
Example 6: Dashboard
Code
Code for Dashboard
# ---- Packages ----
library(shiny)
library(readxl)
library(dplyr)
library(tidyr)
library(DT)
library(ggplot2)
library(patchwork)

# Optional: metR for labeling contour lines (winner margins)
has_metR <- requireNamespace("metR", quietly = TRUE)

# ---- Constants / Mapping ----
domain_map <- c(
  VS = "Visible Signs",
  PS = "Physical Symptoms",
  EW = "Emotional Wellbeing",
  SE = "Side Effects",
  TA = "Treatment Administration"
)
dom_codes <- names(domain_map)
treatment_levels <- paste("Treatment", LETTERS[1:5])
visit_levels     <- c("Baseline", "Month 6", "Month 12")

# Treatment colours (A→E)
trtp_colors <- c(
  "Treatment A" = "#D08F16",
  "Treatment B" = "#FFC82E",
  "Treatment C" = "#35E1D6",
  "Treatment D" = "#C676Fa",
  "Treatment E" = "#8C41C0"
)

# Helpers: code <-> full name
code_to_full <- function(code) unname(domain_map[code])
full_to_code <- function(full) names(domain_map)[match(full, domain_map)]

# ---- Tab 1: Summary Builder ----
build_summary_table <- function(
    dat,
    digits_meanmed = 1,
    digits_sd      = 2,
    digits_minmax  = 1
) {
  validate(need(all(c("USUBJID","TRTP","AVISIT","PARAMCD","AVAL") %in% names(dat)),
                "Input data must contain columns: USUBJID, TRTP, AVISIT, PARAMCD, AVAL"))

  ordered_stats <- c("n", "Mean (SD)", "Median", "Min", "Max")

  out <- dat %>%
    mutate(
      Visit  = factor(AVISIT, levels = visit_levels),
      Domain = dplyr::recode(PARAMCD, !!!domain_map),
      TRTP   = factor(TRTP, levels = treatment_levels)
    ) %>%
    group_by(Visit, Domain, TRTP, .drop = FALSE) %>%
    summarise(
      n      = sum(!is.na(AVAL)),
      mean   = if (n() > 0) mean(AVAL, na.rm = TRUE) else NA_real_,
      sd     = if (n() > 1)  sd(AVAL, na.rm = TRUE) else NA_real_,
      median = if (n() > 0) median(AVAL, na.rm = TRUE) else NA_real_,
      min    = if (n() > 0) min(AVAL, na.rm = TRUE) else NA_real_,
      max    = if (n() > 0) max(AVAL, na.rm = TRUE) else NA_real_,
      .groups = "drop"
    ) %>%
    mutate(
      n_char       = as.character(n),
      mean_char    = ifelse(is.finite(mean),
                            sprintf(paste0("%.", as.integer(digits_meanmed), "f"), mean),
                            NA_character_),
      sd_char      = ifelse(is.finite(sd),
                            sprintf(paste0("%.", as.integer(digits_sd), "f"), sd),
                            NA_character_),
      median_char  = ifelse(is.finite(median),
                            sprintf(paste0("%.", as.integer(digits_meanmed), "f"), median),
                            NA_character_),
      min_char     = ifelse(is.finite(min),
                            sprintf(paste0("%.", as.integer(digits_minmax), "f"), min),
                            NA_character_),
      max_char     = ifelse(is.finite(max),
                            sprintf(paste0("%.", as.integer(digits_minmax), "f"), max),
                            NA_character_)
    ) %>%
    mutate(
      sd_disp      = ifelse(is.na(sd_char), "", sd_char),
      `Mean (SD)`  = ifelse(!is.na(mean_char),
                            paste0(mean_char, " (", sd_disp, ")"),
                            NA_character_)
    ) %>%
    select(Visit, Domain, TRTP,
           `n` = n_char,
           `Mean (SD)`,
           Median = median_char,
           Min = min_char,
           Max = max_char) %>%
    pivot_longer(
      cols = c(`n`, `Mean (SD)`, Median, Min, Max),
      names_to = "Statistic", values_to = "Value"
    ) %>%
    mutate(Statistic = factor(Statistic, levels = ordered_stats)) %>%
    pivot_wider(names_from = TRTP, values_from = Value) %>%
    arrange(Visit, Domain, Statistic) %>%
    select(Visit, Domain, Statistic,
           `Treatment A`, `Treatment B`, `Treatment C`, `Treatment D`, `Treatment E`)

  out$stat_order <- as.integer(out$Statistic)
  out
}

# ---- Tab 2: Mean-by-Visit Builder ----
build_mean_by_visit <- function(dat) {
  dat %>%
    mutate(
      Visit  = factor(AVISIT, levels = visit_levels),
      Domain = dplyr::recode(PARAMCD, !!!domain_map),
      TRTP   = factor(TRTP, levels = treatment_levels)
    ) %>%
    group_by(Domain, Visit, TRTP, .drop = FALSE) %>%
    summarise(
      n    = sum(!is.na(AVAL)),
      mean = if (n() > 0) mean(AVAL, na.rm = TRUE) else NA_real_,
      .groups = "drop"
    ) %>%
    arrange(Domain, Visit, TRTP)
}

# ---- Tab 3: Weighted-score Builder ----
build_weighted_means <- function(dat, weights_raw) {
  if (is.null(weights_raw) || length(weights_raw) != 5) {
    weights_raw <- c(VS = 1, PS = 1, EW = 1, SE = 1, TA = 1)
  }
  w_sum <- sum(weights_raw, na.rm = TRUE)
  if (!is.finite(w_sum) || w_sum <= 0) {
    w <- rep(1/5, 5); names(w) <- dom_codes
  } else {
    w <- as.numeric(weights_raw) / w_sum; names(w) <- names(weights_raw)
  }

  wide <- dat %>%
    mutate(
      Visit = factor(AVISIT, levels = visit_levels),
      TRTP  = factor(TRTP, levels = treatment_levels)
    ) %>%
    select(USUBJID, TRTP, Visit, PARAMCD, AVAL) %>%
    tidyr::pivot_wider(
      names_from = PARAMCD, values_from = AVAL,
      values_fn = list(AVAL = mean)
    )

  weighted <- wide %>%
    rowwise() %>%
    mutate(
      ws = {
        vals <- c(VS = get0("VS", ifnotfound = NA_real_),
                  PS = get0("PS", ifnotfound = NA_real_),
                  EW = get0("EW", ifnotfound = NA_real_),
                  SE = get0("SE", ifnotfound = NA_real_),
                  TA = get0("TA", ifnotfound = NA_real_))
        mask <- !is.na(vals)
        if (!any(mask)) {
          NA_real_
        } else {
          w_eff <- w[mask]; w_eff <- w_eff / sum(w_eff)
          sum(vals[mask] * w_eff, na.rm = TRUE)
        }
      }
    ) %>%
    ungroup()

  weighted %>%
    group_by(Visit, TRTP, .drop = FALSE) %>%
    summarise(
      n    = sum(!is.na(ws)),
      mean = if (n() > 0) mean(ws, na.rm = TRUE) else NA_real_,
      .groups = "drop"
    ) %>%
    arrange(Visit, TRTP)
}

# ---- Tab 4: Helpers (Dominance by Weights, 2D only) ----
mean_matrix_by_visit <- function(means_df, visit_choice) {
  dfv <- means_df %>% filter(Visit == visit_choice)
  M <- matrix(NA_real_, nrow = length(dom_codes), ncol = length(treatment_levels),
              dimnames = list(dom_codes, treatment_levels))
  for (tt in treatment_levels) {
    M[, tt] <- dfv %>%
      filter(TRTP == tt) %>%
      mutate(PARAMCD = names(domain_map)[match(Domain, domain_map)]) %>%
      arrange(factor(PARAMCD, levels = dom_codes)) %>%
      pull(mean)
  }
  M
}
composite_scores <- function(W, M) W %*% M

# Construct full 5-weight vectors for a 2D slice
build_weights_2d <- function(dom_x, dom_y, wx, wy, remainder_mode = "equal", remainder_weights = NULL) {
  wx <- pmax(0, pmin(1, wx))
  wy <- pmax(0, pmin(1, wy))
  mask_triangle <- (wx + wy) <= 1 + 1e-9
  wx[!mask_triangle] <- NA_real_
  wy[!mask_triangle] <- NA_real_

  rest <- 1 - (wx + wy)
  others <- setdiff(dom_codes, c(dom_x, dom_y))

  W <- matrix(0, nrow = length(wx), ncol = 5, dimnames = list(NULL, dom_codes))
  W[, dom_x] <- wx
  W[, dom_y] <- wy

  if (remainder_mode == "manual" && !is.null(remainder_weights)) {
    rw <- as.numeric(remainder_weights[others]); names(rw) <- others
    denom <- sum(rw, na.rm = TRUE)
    if (!is.finite(denom) || denom <= 0) {
      for (o in others) W[, o] <- rest / 3
    } else {
      frac <- rw / denom
      for (o in others) W[, o] <- rest * frac[o]
    }
  } else {
    for (o in others) W[, o] <- rest / 3
  }
  W
}

# Build a triangular grid (2D slice) and compute winner + margin
build_grid_2d <- function(dom_x, dom_y, M, remainder_mode = "equal", remainder_weights = NULL, n = 280) {
  gx <- seq(0, 1, length.out = n)
  grd <- expand.grid(wx = gx, wy = gx) %>%
    filter(wx + wy <= 1 + 1e-9)

  W <- build_weights_2d(dom_x, dom_y, grd$wx, grd$wy, remainder_mode, remainder_weights)
  S <- composite_scores(W, M)
  win_idx <- max.col(S, ties.method = "first")
  winners <- colnames(S)[win_idx]
  margins <- apply(S, 1, function(v) {
    sv <- sort(v, decreasing = TRUE)
    if (length(sv) >= 2) sv[1] - sv[2] else NA_real_
  })

  cbind(grd, W, winner = winners, margin = margins, stringsAsFactors = FALSE)
}

# ---- Small helper: parse contour level string "2, 5, 10" -> numeric vector c(2,5,10)
parse_contour_levels <- function(txt, default = c(2, 5, 10)) {
  if (is.null(txt) || !nzchar(trimws(txt))) {
    lev <- default
  } else {
    raw <- unlist(strsplit(txt, "[,;\\s]+"))
    raw <- raw[nzchar(raw)]
    num <- suppressWarnings(as.numeric(raw))
    lev <- num[is.finite(num)]
    if (length(lev) == 0) lev <- default
  }
  sort(unique(round(lev, 6)))
}

# ---- UI ----
ui <- fluidPage(
  div(
    h1("WWW March 2026", style = "margin-bottom:0px;"),
    h4("NOTE: This app was generated using code provided by Microsoft CoPilot. Code should undergo human review prior to reuse", style = "color:#555; margin-top:4px; margin-bottom:20px;")
  ),
  sidebarLayout(
    sidebarPanel(
      width = 2,
      # Always-visible controls
      fileInput("file", "Upload Excel file (.xlsx)", accept = c(".xlsx")),
      helpText("If no file is uploaded, the app reads 'simulated_cdi_dataset.xlsx' from the app folder."),
      hr(),

      # Tab 1 controls
      conditionalPanel(
        condition = "input.tabs == 'Summary Statistics by Domain'",
        numericInput("digits_meanmed", "Decimal places: Mean & Median", value = 1, min = 0, max = 6, step = 1),
        numericInput("digits_sd",      "Decimal places: SD",            value = 2, min = 0, max = 6, step = 1),
        numericInput("digits_minmax",  "Decimal places: Min & Max",     value = 0, min = 0, max = 6, step = 1),
        hr(),
        downloadButton("download_csv", "Download table (CSV)")
      ),

      # Tab 2 controls
      conditionalPanel(
        condition = "input.tabs == 'Mean Domain Scores by Visit'",
        radioButtons("plot_mode", "Display:", choices = c("All domains" = "all", "Single domain" = "single"),
                     selected = "all"),
        conditionalPanel(
          condition = "input.plot_mode == 'single'",
          selectInput("single_domain", "Domain:", choices = unname(domain_map), selected = "Visible Signs")
        )
      ),

      # Tab 3 controls - weights
      conditionalPanel(
        condition = "input.tabs == 'Weighted Mean Score by Visit'",
        h4("Domain weights"),
        helpText("Enter any non-negative weights; they will be rescaled to sum to 1."),
        numericInput("w_vs", "Visible Signs (VS)",            value = 1, min = 0, step = 0.1),
        numericInput("w_ps", "Physical Symptoms (PS)",        value = 1, min = 0, step = 0.1),
        numericInput("w_ew", "Emotional Wellbeing (EW)",      value = 1, min = 0, step = 0.1),
        numericInput("w_se", "Side Effects (SE)",             value = 1, min = 0, step = 0.1),
        numericInput("w_ta", "Treatment Administration (TA)", value = 1, min = 0, step = 0.1)
      ),

      # Tab 4 controls - 2D dominance slice (user-defined contours)
      conditionalPanel(
        condition = "input.tabs == 'Treatment Dominance by Weights'",
        h4("Weight-space dominance (2D slice)"),
        selectInput("dom_visit", "Visit:", choices = visit_levels, selected = "Month 12"),
        selectInput("dom_x", "Domain X (varies along x):", choices = unname(domain_map), selected = "Visible Signs"),
        selectInput("dom_y", "Domain Y (varies along y):", choices = unname(domain_map), selected = "Physical Symptoms"),
        radioButtons("dom_rest_mode", "Remaining 3 domains:",
                     choices = c("Equal split" = "equal", "Manual (set raw weights)" = "manual"),
                     selected = "equal"),
        conditionalPanel(
          condition = "input.dom_rest_mode == 'manual'",
          sliderInput("rest_w1", "Raw weight for remaining domain 1:", min = 0, max = 10, value = 1, step = 0.1),
          sliderInput("rest_w2", "Raw weight for remaining domain 2:", min = 0, max = 10, value = 1, step = 0.1),
          sliderInput("rest_w3", "Raw weight for remaining domain 3:", min = 0, max = 10, value = 1, step = 0.1)
        ),
        checkboxInput("dom_show_margin", "Show winner margin contours (with labels)", value = TRUE),
        textInput("dom_levels_text", "Contour differences (comma-separated):", value = "2, 5, 10")
      )
    ),
    mainPanel(
      width = 10,
      tabsetPanel(
        id = "tabs",
        tabPanel("Summary Statistics by Domain", DTOutput("summary_tbl")),
        tabPanel("Mean Domain Scores by Visit", br(), plotOutput("plots_domains")),
        tabPanel("Weighted Mean Score by Visit", br(), plotOutput("plot_weighted", height = "450px")),
        tabPanel(
          "Treatment Dominance by Weights",
          br(),
          plotOutput("dom_plot_slice", hover = "dom_hover", height = "600px", width = "600px"),
          br(),
          uiOutput("dom_hover_instruction"),   # <── NEW LINE
          tableOutput("dom_hover_weights"),
          tableOutput("dom_hover_scores")
        )
      )
    )
  )
)

# ---- Server ----
server <- function(input, output, session) {

  # Source data
  raw_data <- reactive({
    if (!is.null(input$file)) {
      readxl::read_excel(input$file$datapath,
                         col_types = c("text", "text", "text", "text", "numeric"))
    } else {
      req(file.exists("simulated_cdi_dataset.xlsx"))
      readxl::read_excel("simulated_cdi_dataset.xlsx",
                         col_types = c("text", "text", "text", "text", "numeric"))
    }
  })

  # ---------- TAB 1 ----------
  summary_table <- reactive({
    digits_meanmed <- if (!is.null(input$digits_meanmed)) input$digits_meanmed else 1
    digits_sd      <- if (!is.null(input$digits_sd))      input$digits_sd      else 2
    digits_minmax  <- if (!is.null(input$digits_minmax))  input$digits_minmax  else 1

    build_summary_table(
      raw_data(),
      digits_meanmed = digits_meanmed,
      digits_sd      = digits_sd,
      digits_minmax  = digits_minmax
    )
  })

  output$summary_tbl <- renderDT({
    df <- summary_table()
    n_cols <- ncol(df)
    stat_order_js_idx <- n_cols - 1L

    datatable(
      df,
      rownames = FALSE,
      extensions = c("FixedColumns","Buttons"),
      options = list(
        dom = "Bfrtip",
        buttons = c("copy", "csv", "excel"),
        pageLength = 25,
        scrollX = TRUE,
        fixedColumns = list(leftColumns = 3),
        orderFixed = list(post = list(list(stat_order_js_idx, 'asc'))),
        columnDefs = list(
          list(orderable = TRUE,  targets = c(0, 1)),
          list(orderable = FALSE, targets = c(2, 3, 4, 5, 6, 7, stat_order_js_idx)),
          list(visible   = FALSE, targets = stat_order_js_idx)
        ),
        order = list()
      )
    )
  })

  output$download_csv <- downloadHandler(
    filename = function() paste0("summary_by_domain_", Sys.Date(), ".csv"),
    content  = function(file) {
      readr::write_csv(summary_table(), file, na = "")
    }
  )

  # ---------- TAB 2 ----------
  mean_by_visit <- reactive({
    build_mean_by_visit(raw_data())
  })

  plot_domain_lines <- function(domain_name, df) {
    ggplot(
      df %>% filter(Domain == domain_name),
      aes(x = Visit, y = mean, group = TRTP, color = TRTP)
    ) +
      geom_line(linewidth = 1) +
      geom_point(size = 2) +
      scale_color_manual(values = trtp_colors, drop = FALSE, guide = guide_legend(title = NULL)) +
      scale_x_discrete(drop = FALSE, limits = visit_levels, expand = expansion(mult = 0.01)) +
      coord_cartesian(ylim = c(0, 100), clip = "on") +
      labs(title = domain_name, x = NULL, y = NULL, color = NULL) +
      theme_minimal(base_size = 12) +
      theme(
        plot.title = element_text(face = "bold", hjust = 0.5),
        legend.position = "bottom",
        panel.grid.major.x = element_blank(),
        panel.grid.minor.x = element_blank(),
        plot.margin = margin(t = 5, r = 16, b = 10, l = 16)
      )
  }

  output$plots_domains <- renderPlot(
    {
      req(mean_by_visit())
      mv <- mean_by_visit()
      mode <- if (!is.null(input$plot_mode)) input$plot_mode else "all"

      if (identical(mode, "single")) {
        dom <- if (!is.null(input$single_domain)) input$single_domain else "Visible Signs"
        plot_domain_lines(dom, mv) + theme(legend.position = "bottom")
      } else {
        p_vs <- plot_domain_lines("Visible Signs",             mv)
        p_ps <- plot_domain_lines("Physical Symptoms",         mv)
        p_ew <- plot_domain_lines("Emotional Wellbeing",       mv)
        p_se <- plot_domain_lines("Side Effects",              mv)
        p_ta <- plot_domain_lines("Treatment Administration",  mv)

        (p_vs | p_ps | p_ew | p_se | p_ta) +
          plot_layout(ncol = 5, guides = "collect") &
          theme(legend.position = "bottom")
      }
    },
    height = function() {
      mode <- if (!is.null(input$plot_mode)) input$plot_mode else "all"
      if (identical(mode, "single")) 520 else 420
    }
  )

  # ---------- TAB 3 ----------
  normalised_weights <- reactive({
    w_raw <- c(
      VS = if (!is.null(input$w_vs)) input$w_vs else 1,
      PS = if (!is.null(input$w_ps)) input$w_ps else 1,
      EW = if (!is.null(input$w_ew)) input$w_ew else 1,
      SE = if (!is.null(input$w_se)) input$w_se else 1,
      TA = if (!is.null(input$w_ta)) input$w_ta else 1
    )
    w_sum <- sum(w_raw, na.rm = TRUE)
    if (!is.finite(w_sum) || w_sum <= 0) {
      w <- rep(1/5, 5); names(w) <- dom_codes; w
    } else {
      w_raw / w_sum
    }
  })

  weighted_means <- reactive({
    req(raw_data())
    build_weighted_means(raw_data(), normalised_weights())
  })

  output$plot_weighted <- renderPlot({
    req(weighted_means())
    dfw <- weighted_means()
    w   <- normalised_weights()
    cap <- sprintf(
      "Weights (normalised): VS=%.2f, PS=%.2f, EW=%.2f, SE=%.2f, TA=%.2f",
      w["VS"], w["PS"], w["EW"], w["SE"], w["TA"]
    )

    ggplot(
      dfw,
      aes(x = Visit, y = mean, group = TRTP, color = TRTP)
    ) +
      geom_line(linewidth = 1.2) +
      geom_point(size = 2.5) +
      scale_color_manual(values = trtp_colors, drop = FALSE, guide = guide_legend(title = NULL)) +
      scale_x_discrete(drop = FALSE, limits = visit_levels, expand = expansion(mult = 0.01)) +
      coord_cartesian(ylim = c(0, 100), clip = "on") +
      labs(title = "Weighted Mean Score by Visit", x = NULL, y = NULL, color = NULL, caption = cap) +
      theme_minimal(base_size = 13) +
      theme(
        plot.title = element_text(face = "bold", hjust = 0.5),
        legend.position = "bottom",
        panel.grid.major.x = element_blank(),
        panel.grid.minor.x = element_blank(),
        plot.margin = margin(t = 5, r = 16, b = 10, l = 16),
        plot.caption = element_text(size = 10, hjust = 0),
        plot.caption.position = "plot"
      )
  })

  # ---------- TAB 4 (2D dominance slice) ----------
  means_by_visit <- reactive({
    build_mean_by_visit(raw_data())
  })

  # Keep Domain Y different from Domain X
  observeEvent(input$dom_x, ignoreInit = TRUE, {
    choices <- setdiff(unname(domain_map), input$dom_x)
    sel <- if (!is.null(input$dom_y) && input$dom_y %in% choices) input$dom_y else choices[1]
    updateSelectInput(session, "dom_y", choices = choices, selected = sel)
  })

  # Update labels of manual sliders for the three remainder domains
  current_remainders <- reactive({
    dx <- full_to_code(input$dom_x)
    dy <- full_to_code(input$dom_y)
    others <- setdiff(dom_codes, c(dx, dy))
    list(codes = others, labels = unname(domain_map[others]))
  })
  observe({
    req(input$dom_rest_mode == "manual")
    rem <- current_remainders()
    if (length(rem$labels) == 3) {
      updateSliderInput(session, "rest_w1", label = paste("Raw weight for", rem$labels[1], "(", rem$codes[1], ")"))
      updateSliderInput(session, "rest_w2", label = paste("Raw weight for", rem$labels[2], "(", rem$codes[2], ")"))
      updateSliderInput(session, "rest_w3", label = paste("Raw weight for", rem$labels[3], "(", rem$codes[3], ")"))
    }
  })

  # Render 2D winner map (with robustly labeled, user-defined contour levels if metR available)
  output$dom_plot_slice <- renderPlot({
    req(means_by_visit()); req(input$dom_x, input$dom_y, input$dom_visit)
    if (identical(input$dom_x, input$dom_y)) return(NULL)

    mv <- means_by_visit()
    M  <- mean_matrix_by_visit(mv, input$dom_visit)
    dx <- full_to_code(input$dom_x)
    dy <- full_to_code(input$dom_y)

    rem <- current_remainders()
    rem_vec <- setNames(c(input$rest_w1, input$rest_w2, input$rest_w3), rem$codes)
    remainder_mode <- if (identical(input$dom_rest_mode, "manual")) "manual" else "equal"

    # Build surface on a reasonably fine grid (helps label placement)
    grid <- build_grid_2d(dx, dy, M, remainder_mode, rem_vec, n = 280)

    # Parse user-entered contour levels (no automatic zero included)
    levels <- parse_contour_levels(input$dom_levels_text, default = c(2, 5, 10))

    # Base map
    p <- ggplot(grid, aes(x = wx, y = wy)) +
      geom_raster(aes(fill = winner), interpolate = TRUE) +
      scale_fill_manual(values = trtp_colors, drop = FALSE, guide = guide_legend(title = NULL)) +
      coord_fixed(ratio=1) +
      coord_cartesian(xlim = c(0,1), ylim = c(0,1)) +
      # Triangle boundary via annotate()
      annotate("segment", x = 0, y = 0, xend = 1, yend = 0, colour = "grey30", linewidth = 0.4) +
      annotate("segment", x = 0, y = 0, xend = 0, yend = 1, colour = "grey30", linewidth = 0.4) +
      annotate("segment", x = 1, y = 0, xend = 0, yend = 1, colour = "grey30", linewidth = 0.4) +
      labs(
        title = paste0("Winner map (", input$dom_x, " vs ", input$dom_y, ") — ", input$dom_visit),
        x = paste0(input$dom_x, " weight"),
        y = paste0(input$dom_y, " weight")
      ) +
      theme_minimal(base_size = 12) +
      theme(
        plot.title = element_text(face = "bold", hjust = 0.5),
        legend.position = "bottom",
        panel.grid.major = element_blank(),
        panel.grid.minor = element_blank()
      )

    # Contours + labels (if enabled)
    if (isTRUE(input$dom_show_margin) && length(levels) > 0) {
      # Draw contour lines
      p <- p + geom_contour(
        aes(z = margin),
        breaks = levels,
        colour = "white",
        alpha = 0.8,
        linewidth = 0.52
      )
      # Add numeric labels on contours if metR is available
      if (has_metR) {
        p <- p + metR::geom_text_contour(
          aes(z = margin),
          breaks = levels,
          # Multiple placement positions per level → fewer missing labels
          label.placer = metR::label_placer_fraction(c(0.2, 0.5, 0.8)),
          # Be permissive: allow small/curvy segments, don't skip
          min.size = 0,
          skip = 0,
          # Readable over raster & white lines
          size = 3.2,
          colour = "black",
          stroke = 0.25,
          stroke.color = "white"
        )
      }
    }

    p
  })

  # Hover -> weights (2D)
  last_weights <- reactiveVal(NULL)
  observeEvent(input$dom_hover, {
    hv <- input$dom_hover
    req(!is.null(hv), means_by_visit())
    x <- hv$x; y <- hv$y
    if (is.null(x) || is.null(y) || x < 0 || y < 0 || x > 1 || y > 1 || (x + y) > 1) return()

    dx <- full_to_code(input$dom_x)
    dy <- full_to_code(input$dom_y)
    rem <- current_remainders()

    remainder_mode <- if (identical(input$dom_rest_mode, "manual")) "manual" else "equal"
    rem_vec <- setNames(c(input$rest_w1, input$rest_w2, input$rest_w3), rem$codes)

    W <- build_weights_2d(dx, dy, wx = x, wy = y, remainder_mode, rem_vec)
    w_vec <- as.numeric(W[1, ]); names(w_vec) <- colnames(W)
    if (abs(sum(w_vec) - 1) > 1e-6) w_vec <- w_vec / sum(w_vec)
    last_weights(w_vec)
  }, ignoreInit = TRUE)

  output$dom_hover_instruction <- renderUI({
    HTML("<div style='font-size:13px; color:#555; margin-bottom:10px;'>
         <b>Hover over any point in the above plot to update the weights below.</b>
       </div>")
  })

  output$dom_hover_weights <- renderTable({
    w <- last_weights(); if (is.null(w)) return(NULL)
    data.frame(Domain = code_to_full(names(w)), Weight = round(w, 3), row.names = NULL)
  })

  output$dom_hover_scores <- renderTable({
    w <- last_weights(); req(w)
    mv <- means_by_visit(); req(mv)
    M  <- mean_matrix_by_visit(mv, input$dom_visit)
    S <- as.numeric(matrix(w, nrow = 1) %*% M)
    names(S) <- colnames(M)
    df <- data.frame(Treatment = names(S), Composite_Mean = round(S, 2), row.names = NULL)
    df <- df[order(-df$Composite_Mean), , drop = FALSE]
    df$Rank <- seq_len(nrow(df))
    df[, c("Rank", "Treatment", "Composite_Mean")]
  })
}

# ---- Run App ----
shinyApp(ui, server)