Designing visual patient profiles
The visualisations below present patient level data in one plot or multiple aligned plots. Interactive visualisations are shown allowing to expand and collapse selected details. The use of color and pre-attentive attributes is supporting easy interpretation of the data.
Example 1. One plot solution
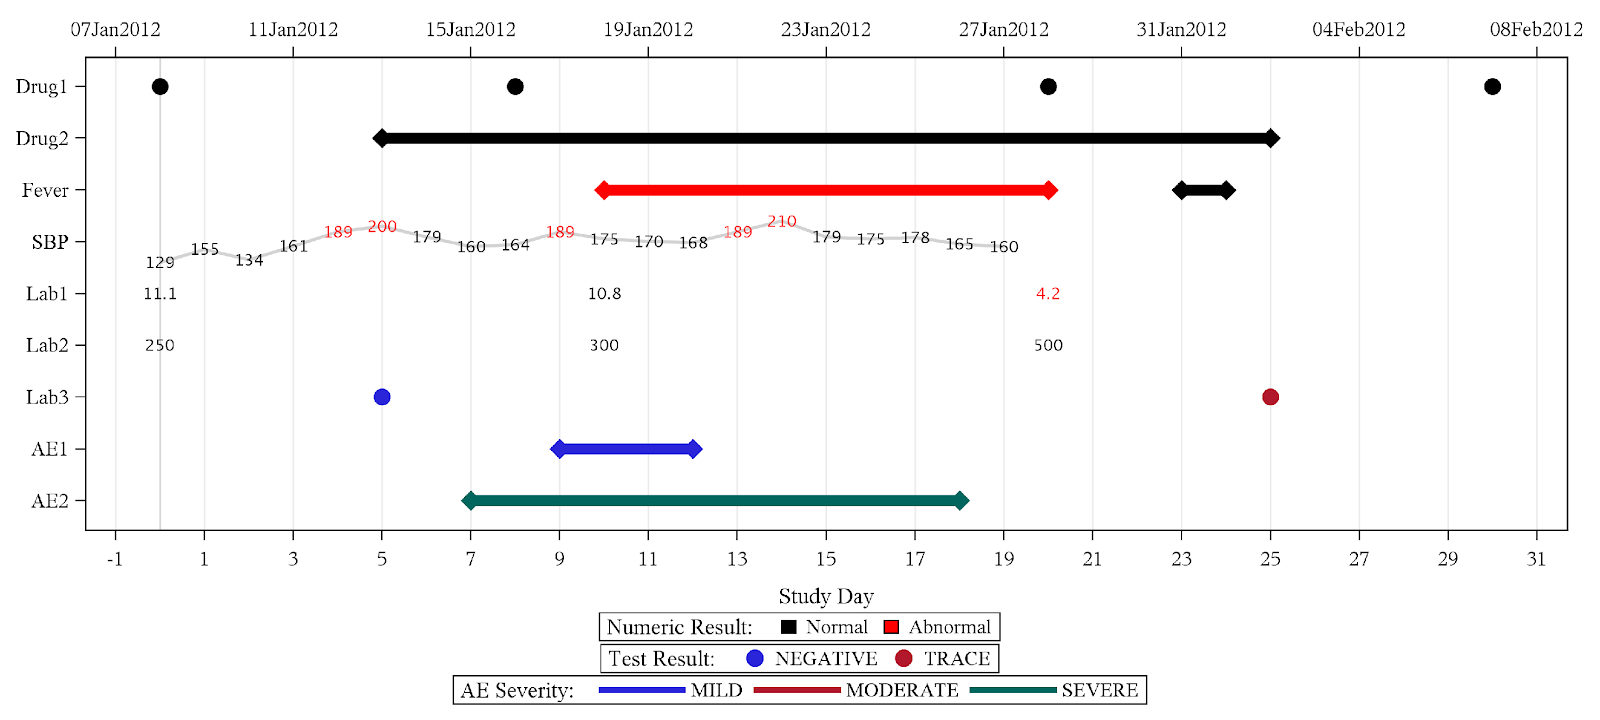
This visualisations gives a time-aligned overview on study drug intake, adverse events, laboratory values and other information with very little clutter. Blood pressure is given as line plot with values. Color coding is used for abnormal values and AE severity.
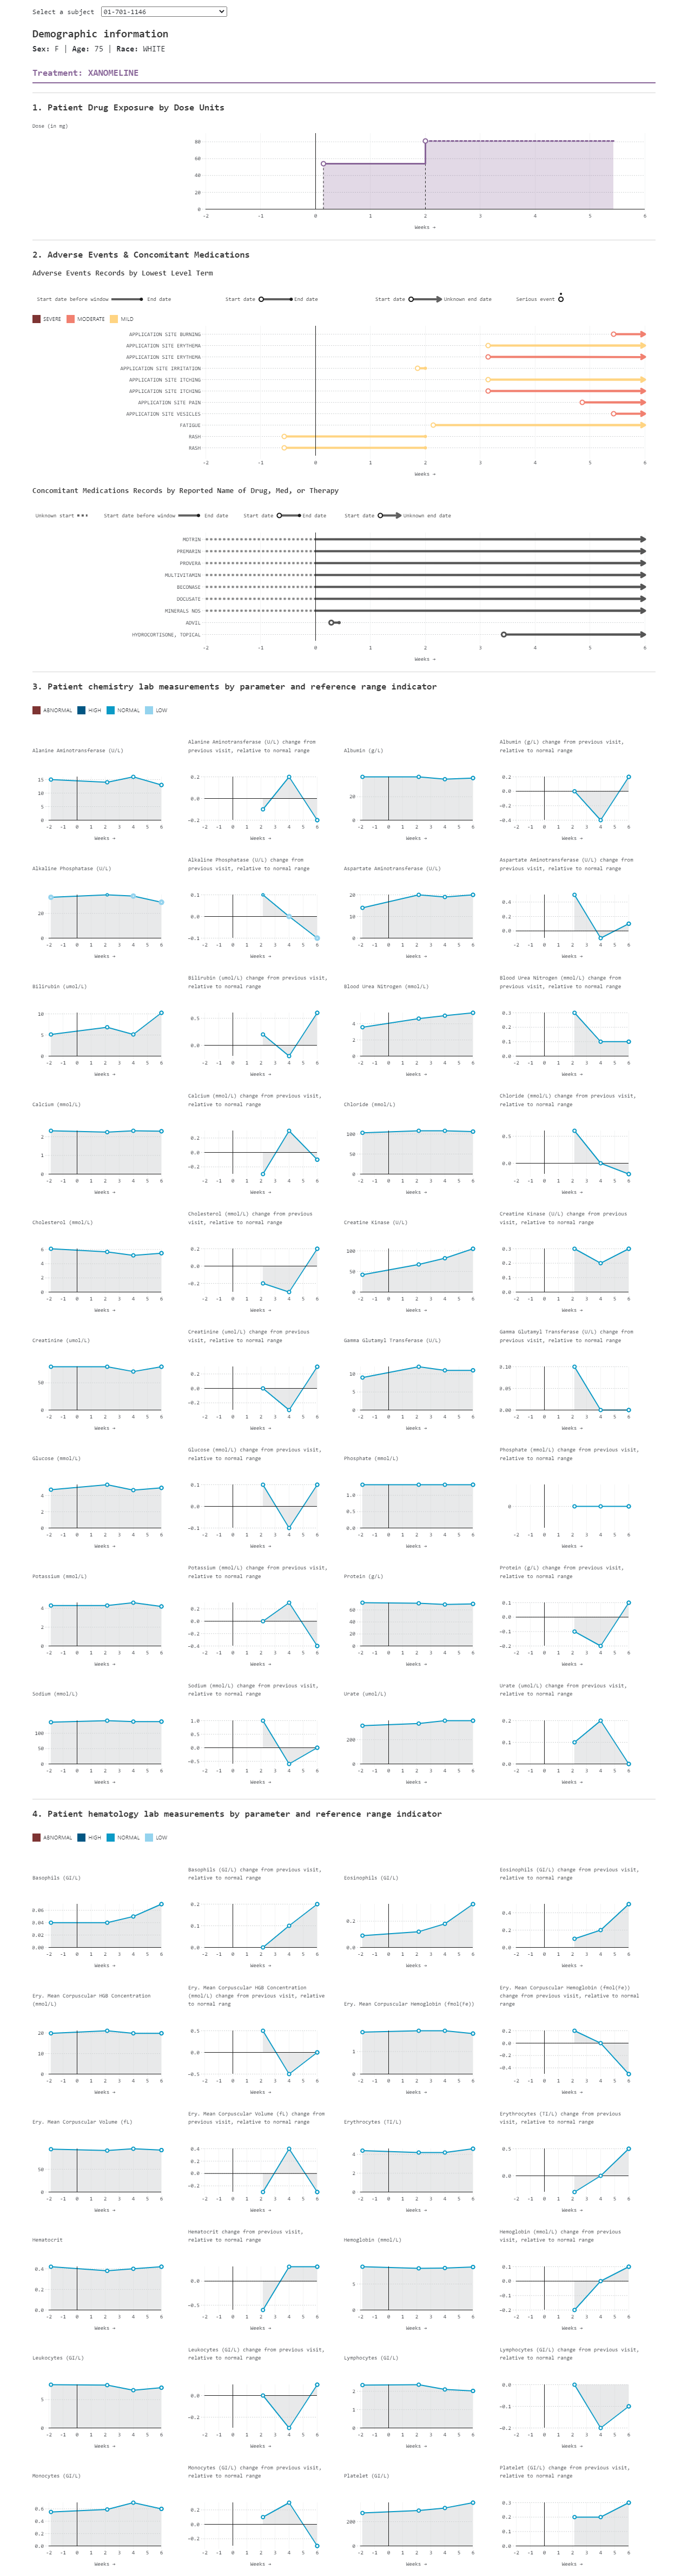
Example 2. D3 patient profile
Multiple plots with aligned time axis are showing drug exposure, adverse events and concomitant medication. Lab values over time and changes are displayed in facet plots with highlighted abnormal values.
Example 3. Grable
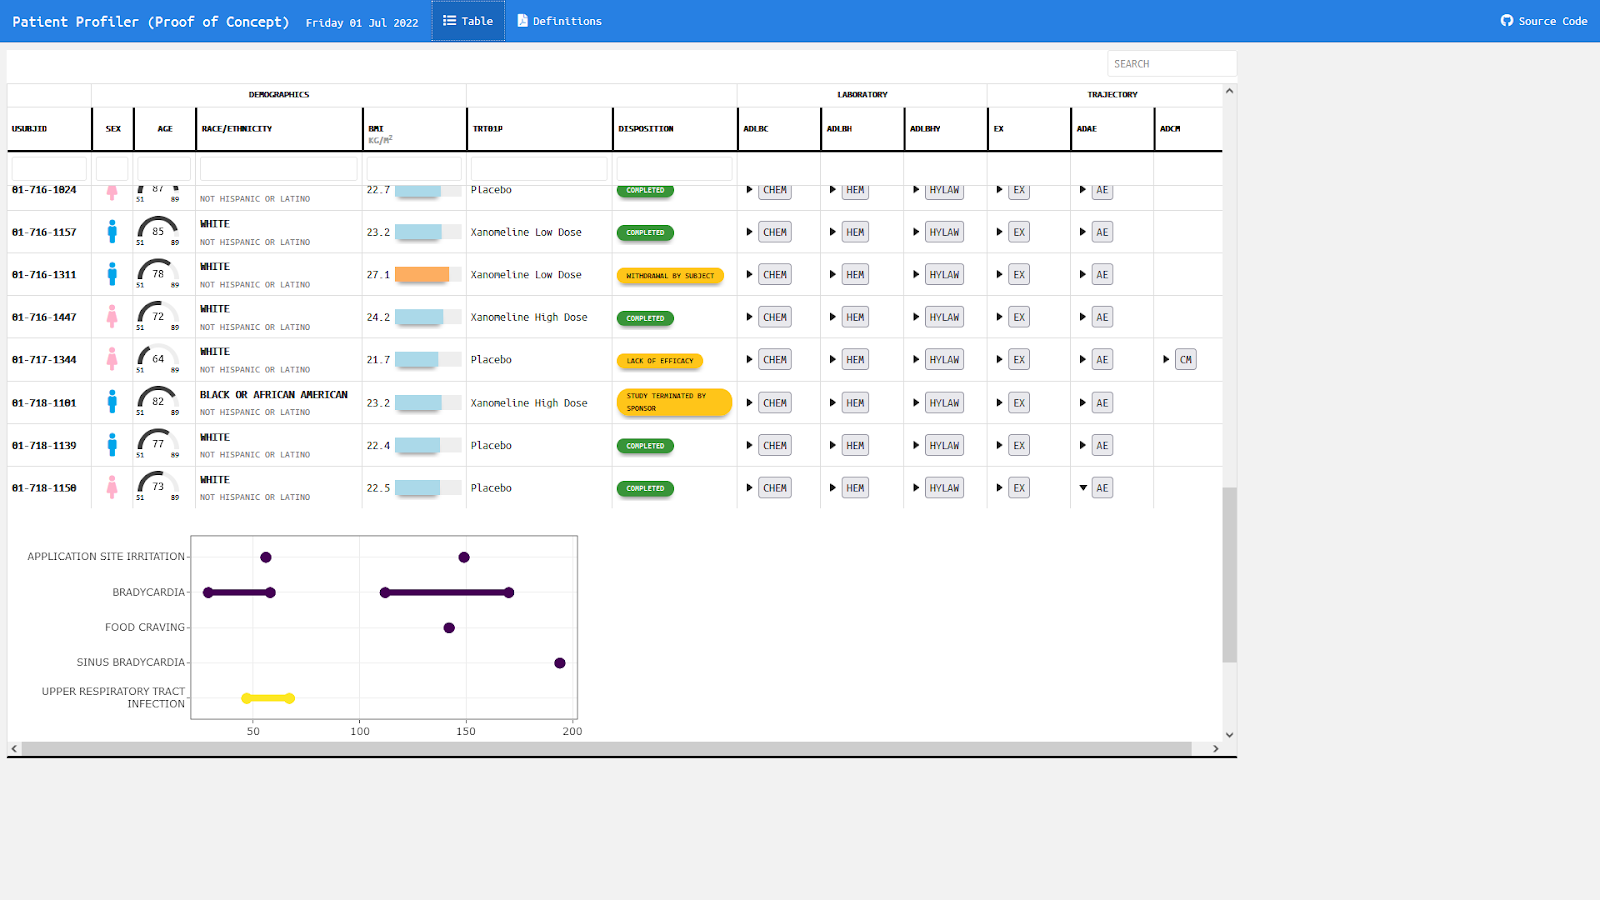
The app can be found here.
This table with embedded graphics is giving an overview over all subjects with the option to expand and collapse additional information. Demographic data are displayed in symbols, gauge charts, text, color coded bar charts, or color supported descriptive text respectively. Population ranges are given as gray background where possible.
Example 4. Table-Graph-combination
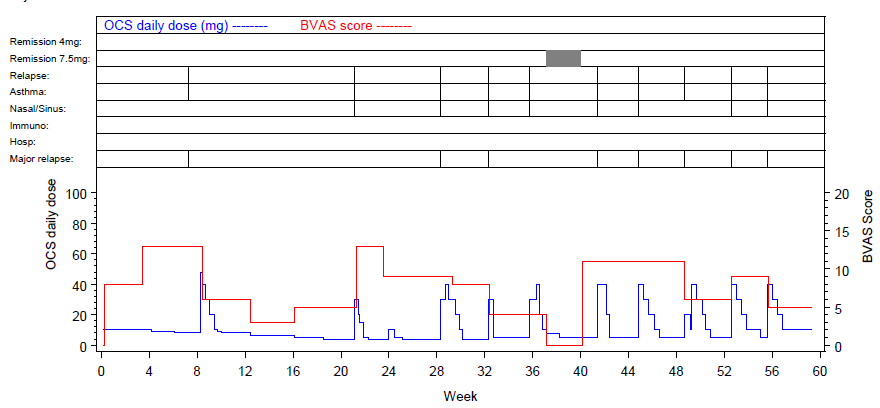
This is an example out of the context of the challenge. It’s showing a possibility to include outcome values over time and dosing in addition to textual information.
Code
Example 1. One plot solution
No code has been submitted.
Example 2. D3 patient profile
The code can be found here.
Example 3. Grable
No code has been submitted.
Example 4. Table-Graph-combination
The code can be found here.