Mobile app data
This was a 12-week small scale, open-label, parallel-group, randomised controlled trial of the app compared with usual care in people with mild-moderate COPD. The aim of the trial was to establish if the delivery of the self-management app would improve patients COPD impact. For this 60 participants were randomised 1:1 to either the app (N=29) or to usual care (N=31) and were stratified by COPD Severity, the study was not fully powered.
In the intervention arm:
- How does individual app usage change over time?
- How does app usage impact individual symptom and CAT scores?
The challenge was to explore these patterns/relationships visually.
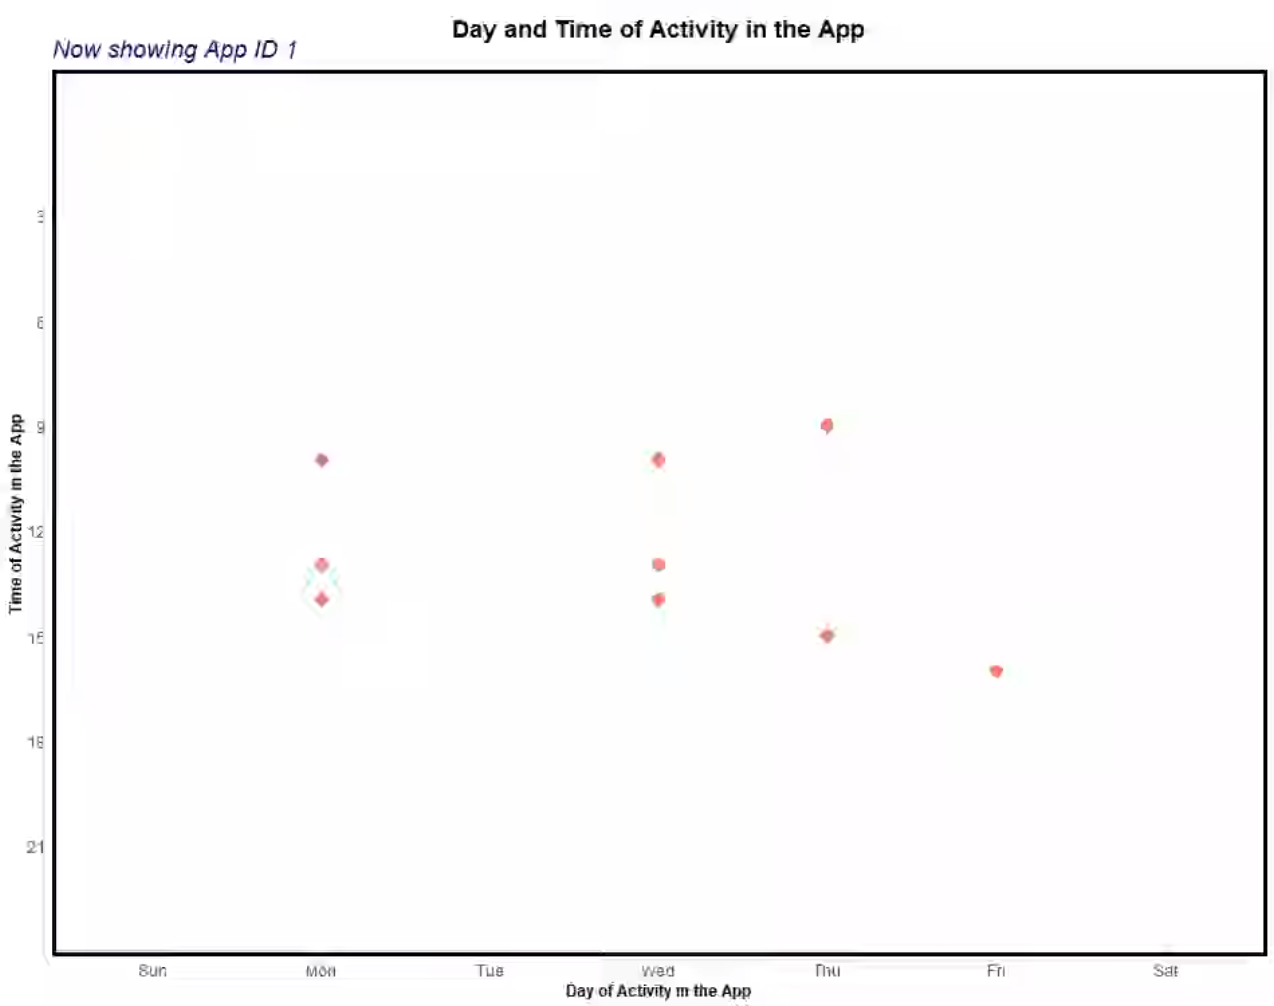
Example 1. Animation: Dot plot over time
The video can be found here.
Pros: This is a more effective replacement to patient profile listings. It’s easy at a glance to detect patterns across patients: for example some patients had more data compared to others. You can compare across days if there are different activities for each subject.
Cons:
- Difficult to see activities that occur on different weeks and at the same week day and time.
- Difficult to compare across individuals
- Use of the inverted y-axis where the bottom is maximum and the top is minimum can be viewed as counter-intuative. It would be great to align to the usual conventions of the minimum being at the bottom and the maximum at the top.
- Use of different colours for each patient is ineffective as each patient is shown separately.
Possible improvements: Add an explanation to explain that activities occuring on the same week day for different weeks will be overlaid. Jittering could be used to show information where there is an overlay Frequency of activities is not visible and the size/area of the symbols could be adjusted to reflect this An overall plot showing all patients could be provided to check if there is a pattern over all patients A more effective way would be to show all the patients in grey and the patient for that panel in colour. This will help in comparing the patient to all the subjects.
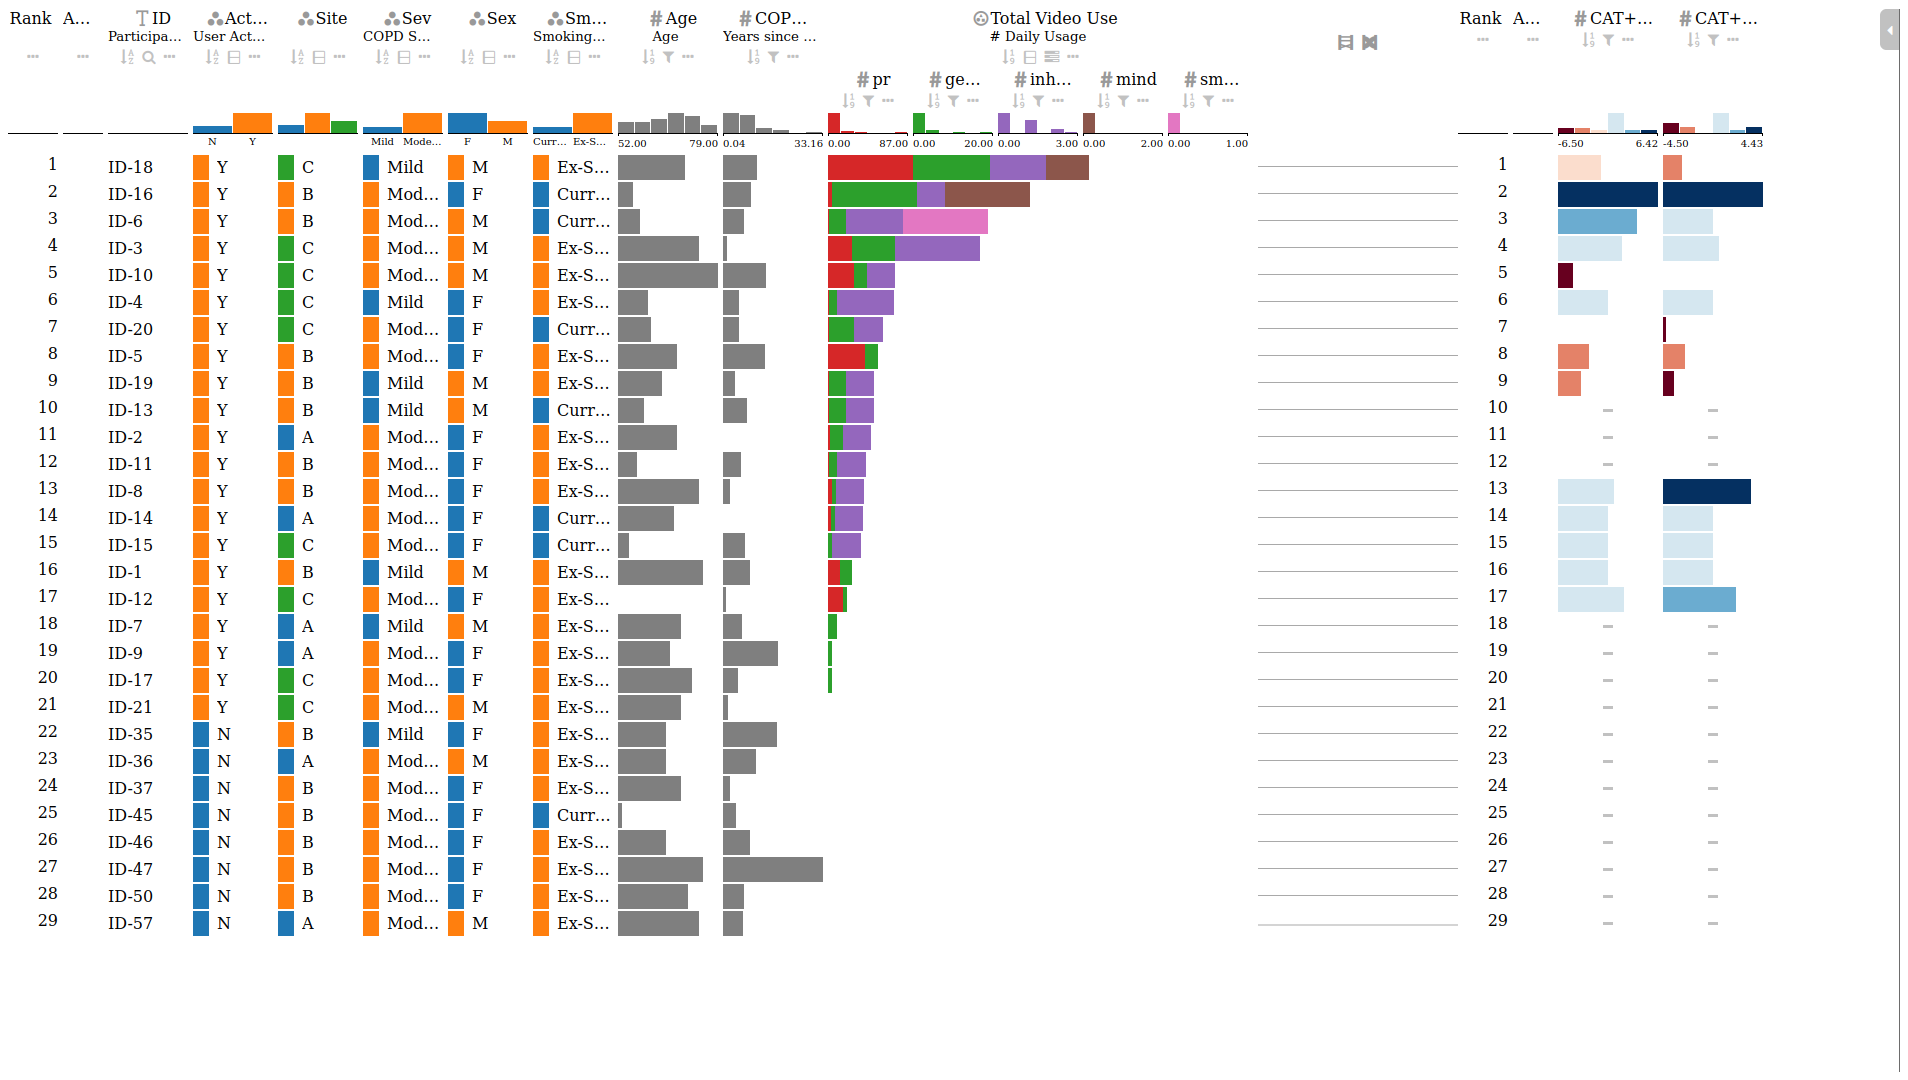
Example 2. Dashboard/Multiplot: LineUp
The app can be found here.
Pros:
- A great exploration tool - with all the information at one glance.
- Great exploration functionalities such as sorting, filtering and analysis
- The explanation video helps to understand the features and functionalities of the dashboard.
- An additional benefit of being able to see the distribution of the variables of interest through use of the bar/histogram charts
- The visualisation is easily extended to different types of datasets, which for example can be part of an appendix of clinical documents
Cons: It might be difficult to view on smaller screens
Possible improvements:
- There was a debate among the panelists on the advantages and disadvantages of the reuse of colour. There was a suggestion that it might be good to use intuitive colors, for example for COPD severity
- light red or orange or dark red for severity. Another suggestion was to use different shades of grey for baseline characteristics.
Example 3. Visualization app
The app can be found here.
Pros:
- A great exploration tool - with all the information at one glance.
- Great exploration functionalities such as sorting, filtering and analysis
- The explanation video helps to understand the features and functionalities of the dashboard.
- An additional benefit of being able to see the distribution of the variables of interest through use of the bar/histogram charts
- The visualisation is easily extended to different types of datasets, which for example can be part of an appendix of clinical documents
Cons: It might be difficult to view on smaller screens
Possible improvements:
- There was a debate among the panelists on the advantages and disadvantages of the reuse of colour. There was a suggestion that it might be good to use intuitive colors, for example for COPD severity
- light red or orange or dark red for severity. Another suggestion was to use different shades of grey for baseline characteristics.
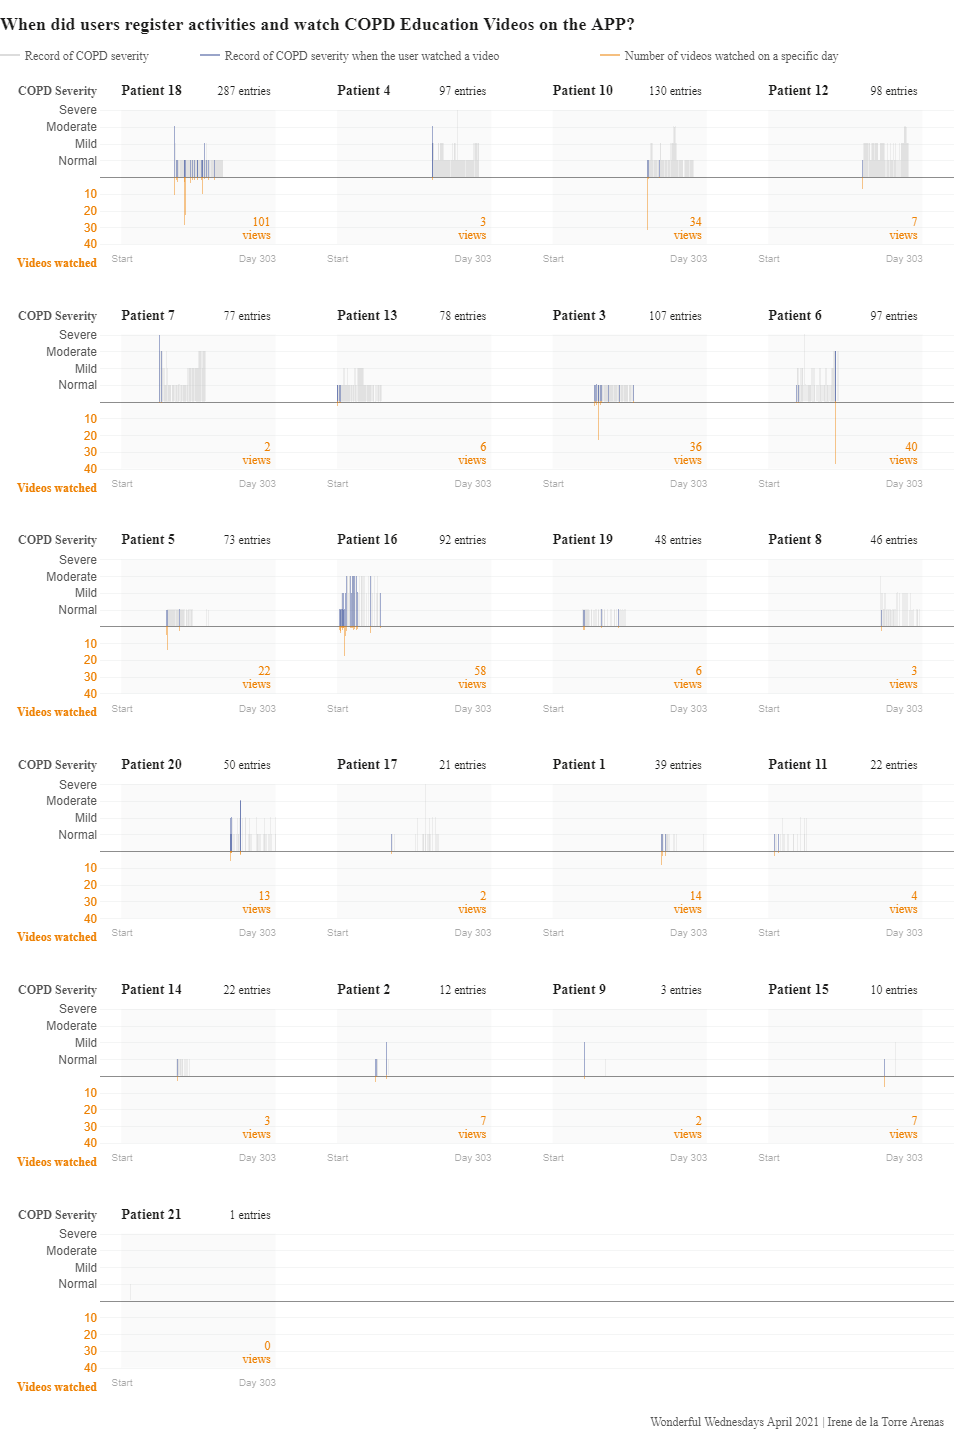
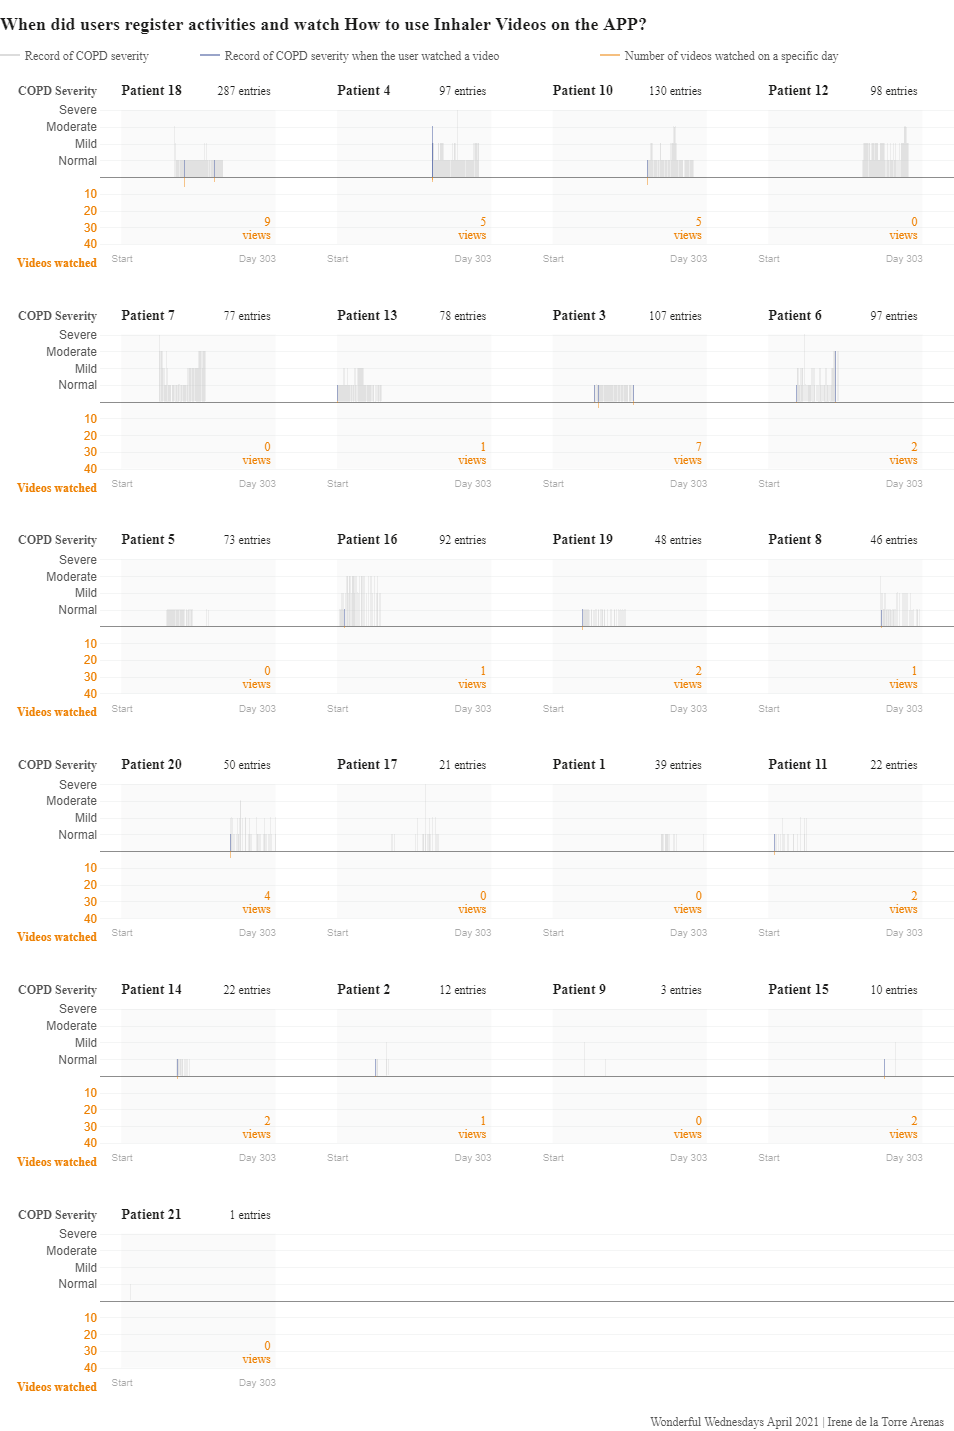
Example 3. Visualization app
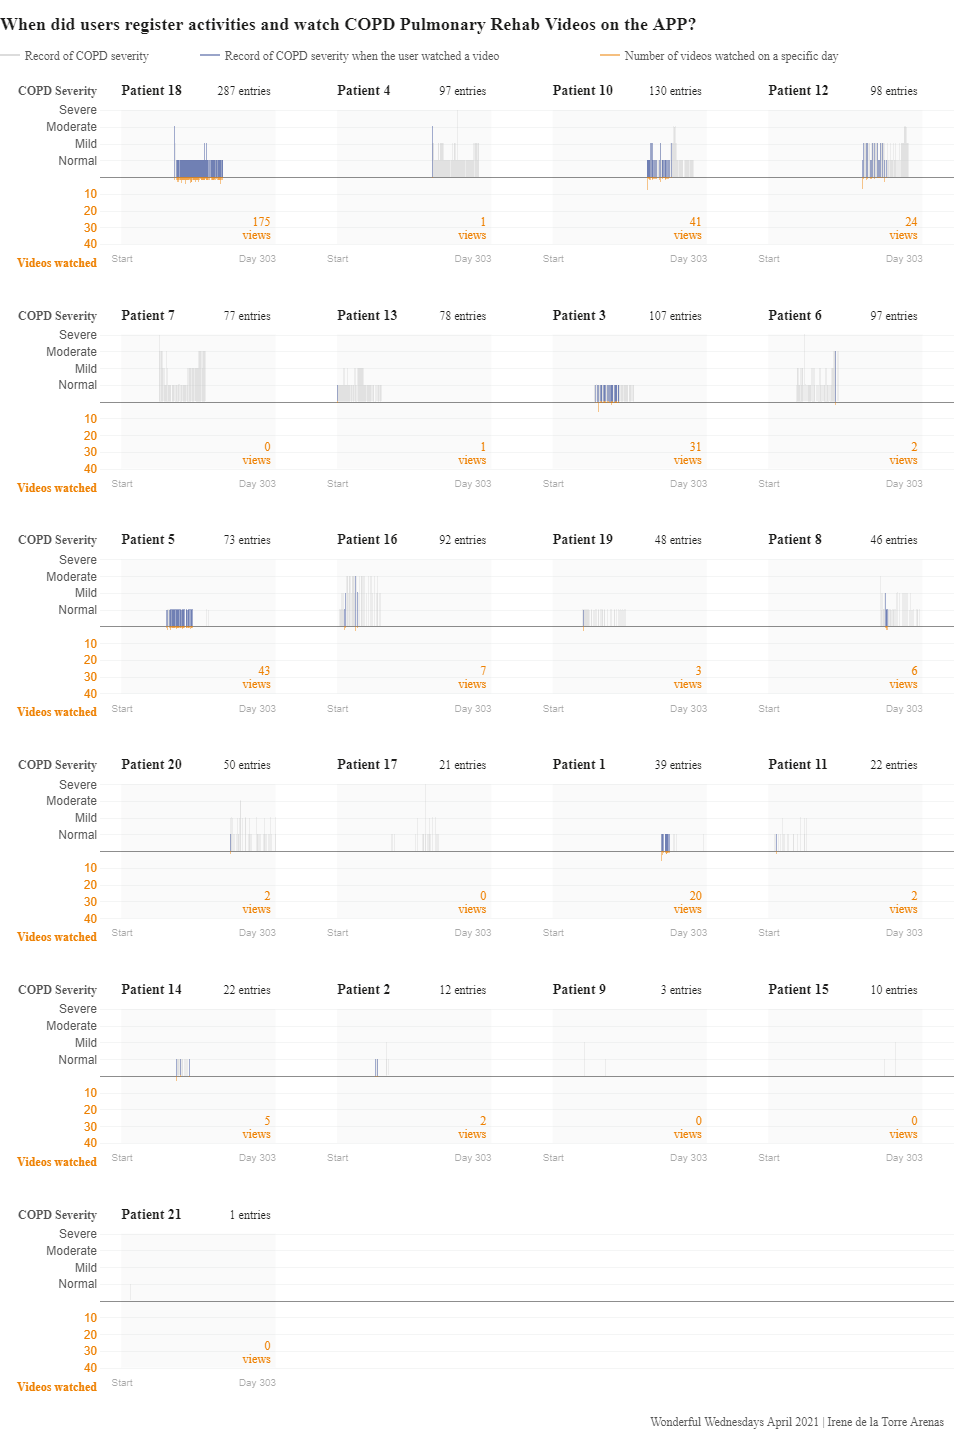
Comments for the visualisation with the title: When did users register activities and watch COPD Education Videos on the App?
Pros:
- The overall organisation is great. The layout is crisp, clean and has very limited distractions.
- It’s great to see all patients in one view.
- The functionality of different sorting by the variable of interest makes it versatile to explore these.
- Showing all the other patients data in grey makes it easier to compare the selected patient across all patients.
- The graph can be extended to other graphs we see in clinical trials
- The clever use of the right aligning y-axis tick labels on the left makes it easier to connect the words with the horizontal lines.
Cons: The tradeoff of showing all patients in one view is that the lines for some patients will be very small
Possible improvements: There is a great variation in the number videos watched and the scale may benefit from using a logarithmic scale or cut off data (e.g. greater than 10)
Other representations: If the aim is to explore within patient patterns it might be best to have a filter to select a patient and the visualisation will show the different types of videos watched by that patient.
Code
Example 1. Animation: Dot plot over time
# Data viz PSI

#install.packages("readxl")
library("readxl")
library(lubridate)
library(dplyr)
library(ggplot2)
library(rayshader)
library(viridis)
library(gganimate)
library(scales)

setwd("C:/Users/lsh1703883/Documents/Data visualisation PSI")

viz_data <- read_excel("mobile app data.xlsx")

View(viz_data)

summary(viz_data)

str(viz_data)

viz_data$time <- lubridate::with_tz(viz_data$time, "Europe/London")
# hour
viz_data$hour <- hour(viz_data$time)
table(viz_data$hour)
# day
viz_data$day <- wday(viz_data$date, label=TRUE)
table(viz_data$day)


# day of the week

viz_data <- viz_data %>%
  group_by(AppID) %>% mutate(session=1:n())


viz_data <- viz_data %>%
  group_by(AppID, date) %>% count(day,hour)


viz_data <- na.omit(viz_data)

View(viz_data)


p <- ggplot(
  viz_data,
  aes(x = as.factor(day), y=as.numeric(hour), size= 8)) +
  geom_point(aes(fill = as.factor(AppID), colour=as.factor(AppID)))  +
  xlab("Day of Activity in the App")+
  ylab("Time of Activity in the App ")+
  labs(color = "Scenario")+
  scale_color_discrete()+
  theme_minimal()+
  guides(size = TRUE)+
  guides(alpha = FALSE)+
  guides(linetype = FALSE)+
  theme(legend.position = "none")+
  theme(axis.text = element_text(size = 12),
        title = element_text(size = 12,face="bold"),
        panel.border= element_rect(size=2,color="black",fill=NA))+
  scale_y_continuous(trans = "reverse",breaks=seq(3,21,3))


p

library(transformr)
library(av)

p <- p + transition_states(AppID, transition_length = 15, state_length = 15) +
  ggtitle(label = "Day and Time of Activity in the App",
          subtitle= 'Now showing App ID {closest_state}')


p <- p + theme(plot.subtitle=element_text(size=18, hjust=0, face="italic", color="dark blue")) +
  theme(plot.title=element_text(size=18, hjust=0.5, colour="black", vjust=-1))


final_animation<-animate(p,100,fps = 20,duration = 30, width = 950, height = 750,
                         renderer = av_renderer())


anim_save("./data_viz.mp4",animation=final_animation)
Example 2. Dashboard/Multiplot: LineUp
The rmd file can be found here.
Example 3. Visualization app
The code can be found here.