---
title: " "
output:
html_document:
self_containded: TRUE
code_download: yes
code_folding: none # none hide show
toc: false
---
```{r setup, include=FALSE}
knitr::opts_chunk$set(warning = FALSE, message = FALSE, comment = NA, include = FALSE)
knitr::opts_chunk$set(cache = FALSE)
```
```{r}
pacman::p_load(tidyverse, rio)
pacman::p_load(gt, gtsummary)
pacman::p_load(tidybayes)
library(brms)
pacman::p_load(sjstats)
pacman::p_load(labelled)
```
```{r}
d1 <- import("https://raw.githubusercontent.com/VIS-SIG/Wonderful-Wednesdays/master/data/2020/2020-10-14/mediation_data.csv") %>%
janitor::clean_names(case = 'old_janitor')%>%
mutate(trt = as.factor(trt))
d1 %>%
export("mediation_data.csv")
```
```{r}
set.seed(12345)
d2 <- d1 %>%
mutate(itch_miss = ifelse(itch_locf == TRUE, NA, itch),
bsa_miss = ifelse(bsa_locf == TRUE, NA, bsa),
redness_miss = ifelse(redness_locf == TRUE, NA, redness),
dlqi_miss = ifelse(dlqi_locf == TRUE, NA, dlqi)) %>%
select(trt,
itch_locf = itch, bsa_locf = bsa, redness_locf = redness,
dlqi_locf = dlqi,
contains("_miss")) %>%
pivot_longer(cols = c('itch_locf', 'bsa_locf', 'redness_locf',
'itch_miss', 'bsa_miss', 'redness_miss'),
names_to = "med_name",
values_to = "med_value") %>%
drop_na(med_value) %>%
pivot_longer(cols = c('dlqi_locf','dlqi_miss'),
names_to = "dv_name",
values_to = "dv_values") %>%
drop_na(dv_values) %>%
group_by(dv_name, med_name) %>%
nest_by() %>%
filter(dv_name == "dlqi_locf") %>%
mutate(med = list( brm( bf(med_value ~ trt) +
bf(dv_values ~ trt + med_value) + set_rescor(FALSE),
data = data )
)
)
```
```{r}
pacman::p_load(DiagrammeR, vtree)
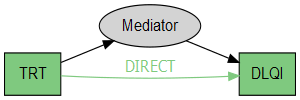
grViz("digraph causal {
# Nodes
node [shape = reactangle, fontname = Arial, style = filled]
iv [label = 'TRT', fillcolor = '#7FC97F']
me [label = 'Mediator', shape = ellipse]
dv [label = 'DLQI', fillcolor = '#7FC97F']
# Edges
edge [color = black, arrowhead = normal]
rankdir = LR
iv -> me
iv -> dv [label = 'DIRECT', fontcolor = '#7FC97F', color = '#7FC97F']
me -> dv
# Graph
graph [overlap = true, fontsize = 10]
}") %>%
grVizToPNG(width = 300,
height = 100,
filename = "_direct.png")
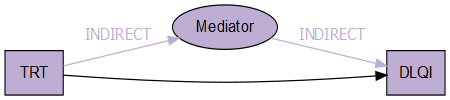
grViz("digraph causal {
# Nodes
node [shape = reactangle, fontname = Arial, style = filled]
iv [label = 'TRT', fillcolor = '#BEAED4']
me [label = 'Mediator', fillcolor = '#BEAED4', shape = ellipse]
dv [label = 'DLQI', fillcolor = '#BEAED4']
# Edges
edge [color = black, arrowhead = normal]
rankdir = LR
iv -> me [label = 'INDIRECT', fontcolor = '#BEAED4', color = '#BEAED4']
iv -> dv [label = ' ']
me -> dv [label = 'INDIRECT', fontcolor = '#BEAED4', color = '#BEAED4']
# Graph
graph [overlap = true, fontsize = 10]
}") %>%
grVizToPNG(width = 450,
height = 100,
filename = "_indirect.png")
```
```{r}
d3 <- d2 %>%
mutate(med_results = list( sjstats::mediation(med, prob = 0.95, typical = "mean") %>%
as.data.frame() %>%
pivot_wider(names_from = "effect",
values_from = c("value","hdi.low","hdi.high"),
names_glue = "{effect}_{.value}")),
post_data = list( posterior_samples(med) %>%
transmute(direct = b_dvvalues_trtRx,
indirect = b_medvalue_trtRx * b_dvvalues_med_value,
total = direct + indirect,
p_mediated = indirect/total) ),
p_mediated_col = cut( med_results$`proportion mediated_value`,
breaks = seq(-1, 1, 0.2),
labels = RColorBrewer::brewer.pal(10,"RdYlBu") ),
gg_mediated = list(post_data %>%
ggplot(aes(x = p_mediated)) +
stat_slab(fill = p_mediated_col, alpha = 0.5) +
geom_vline(xintercept = 0, color = "black", size = 3) +
labs(x = NULL,
y = NULL) +
coord_cartesian(xlim = c(-2.5, 2.5),
ylim = c(-0.01, 1),
expand = FALSE) +
theme_void()),
gg_effect = list(post_data %>%
select(direct, indirect) %>%
pivot_longer(cols = 1:2) %>%
ggplot(aes(x = value, fill = name)) +
stat_slab(alpha = 0.75) +
geom_vline(xintercept = 0, color = "black", size = 3) +
labs(x = NULL,
y = NULL) +
scale_fill_brewer(palette = "Accent") +
coord_cartesian(xlim = c(-10, 5),
ylim = c(-0.01, 1),
expand = FALSE) +
theme_void()+
guides( fill = FALSE))
)
```
```{r}
fmt_ggplot <- function(
data,
columns,
rows = NULL,
height = 100,
aspect_ratio = 1.0) {
rows <- rlang::enquo(rows)
fmt(
data = data,
columns = columns,
rows = !!rows,
fns = list(
html = function(x) {
map(
x,
ggplot_image,
height = height,
aspect_ratio = aspect_ratio
)
}
)
)
}
```
```{r include = TRUE, echo = FALSE}
t1 <- d3 %>%
ungroup() %>%
separate(med_name, c("var","anly"), "_") %>%
mutate(var = factor(var, labels = c("BSA","Itch","Redness")) %>%
fct_relevel("Itch","Redness","BSA"),
anly = factor(anly, labels = c("Analyses w/ LOCF","Analyses w/ Observed"))) %>%
filter(dv_name %>% str_detect("locf")) %>%
group_by(anly) %>%
select(-data, -med, -post_data) %>%
unnest(cols = med_results) %>%
arrange(var) %>%
gt() %>%
cols_hide(vars(dv_name, total_value,
total_hdi.low, total_hdi.high, p_mediated_col,
mediator_value, mediator_hdi.low, mediator_hdi.high)) %>%
cols_move(vars(gg_effect), vars(indirect_value)) %>%
cols_align(align = "left", columns = vars(var)) %>%
fmt_number(columns = vars(direct_value, direct_hdi.low, direct_hdi.high),
n_sigfig = 2) %>%
cols_merge(columns = vars(direct_value, direct_hdi.low, direct_hdi.high),
pattern = "{1}
({2}, {3})"
) %>%
fmt_number(columns = vars(indirect_value, indirect_hdi.low, indirect_hdi.high),
n_sigfig = 2) %>%
cols_merge(columns = vars(indirect_value, indirect_hdi.low, indirect_hdi.high),
pattern = "{1}
({2}, {3})"
) %>%
fmt_number(columns = vars(`proportion mediated_value`, `proportion mediated_hdi.low`, `proportion mediated_hdi.high`),
n_sigfig = 2) %>%
cols_merge(columns = vars(`proportion mediated_value`, `proportion mediated_hdi.low`, `proportion mediated_hdi.high`),
pattern = "{1}
({2}, {3})"
) %>%
tab_style(
style = cell_text(weight = "bold"),
locations = cells_body(
columns = vars(direct_value),
rows = sign(direct_hdi.low) == sign(direct_hdi.high)
)
) %>%
tab_style(
style = cell_text(weight = "bold"),
locations = cells_body(
columns = vars(indirect_value),
rows = sign(indirect_hdi.low) == sign(indirect_hdi.high)
)
) %>%
tab_style(
style = cell_text(weight = "bold"),
locations = cells_body(
columns = vars(`proportion mediated_value`),
rows = sign(`proportion mediated_hdi.low`) == sign(`proportion mediated_hdi.high`)
)
) %>%
data_color(
columns = vars(`proportion mediated_value`),
colors = scales::col_bin(
palette = RColorBrewer::brewer.pal(10,"RdYlBu"),
domain = seq(-1, 1, 0.2),
bins = 10),
alpha = 0.5,
autocolor_text = FALSE
) %>%
fmt_ggplot(
columns = vars(gg_mediated, gg_effect),
height = 40,
aspect_ratio = 3
) %>%
cols_label(var = "Mediator",
direct_value = html(' Direct '),
indirect_value = html(' Indirect '),
`proportion mediated_value` = html("Proportion
Mediated"),
gg_mediated = html("Viz(Mediated)
− ←‒ 0 ‒→ +"),
gg_effect = html("Viz(Effect)
− ←‒‒‒‒‒‒ 0 → +")
)%>%
tab_header(
title = md("**Mediation Results** based on Bayesian models"),
subtitle = md("Is the **Treatment** Effect on **DLQI** mediated?")
) %>%
tab_footnote(locations = cells_title("subtitle"),
footnote = "Dermatology Life Quality Index (DLQI) at 24 weeks. DLQI ranges from 0 to 30
the lower score the better") %>%
tab_footnote(locations = cells_body(
columns = "var",
rows = var %in% c("Itch","Redness")
),
footnote = "Patient self report daily, ranges from 0-10 and averaged every week. The lower the score the better") %>%
tab_footnote(locations = cells_body(
columns = "var",
rows = var == "BSA"
),
footnote = "Physician measure, ranges from 0-100%. The lower the score the better") %>%
tab_footnote(locations = cells_row_groups(groups = "Analyses w/ LOCF"),
footnote = "Missing data was imputed using Last Observation Carried Forward (LOCF)") %>%
tab_footnote(locations = cells_column_labels(
columns = vars(`proportion mediated_value`)
),
footnote = html('Proportion Mediated: is the ratio of the INDIRECT effect to the total effect ( DIRECT + INDIRECT )')) %>%
tab_source_note(html(
details::details(
' %
tab_source_note(html(
details::details(
'
%
tab_source_note(html(
details::details(
' %
opt_align_table_header( align = "left") %>%
opt_all_caps(locations = "column_labels") %>%
tab_options(table.font.size = px(14),
data_row.padding = px(2),
row_group.font.weight = "bold",
footnotes.font.size = px(12),
footnotes.padding = px(1)) %>%
opt_table_font(
font = list(google_font(name = "Source Sans Pro"))
)
t1
```
%
opt_align_table_header( align = "left") %>%
opt_all_caps(locations = "column_labels") %>%
tab_options(table.font.size = px(14),
data_row.padding = px(2),
row_group.font.weight = "bold",
footnotes.font.size = px(12),
footnotes.padding = px(1)) %>%
opt_table_font(
font = list(google_font(name = "Source Sans Pro"))
)
t1
```