Wonderful-Wednesdays
Repository to hold the data and materials for the Wonderful Wednesday webinar series https://www.psiweb.org/sigs-special-interest-groups/visualisation/welcome-to-wonderful-wednesdays
Fatty liver disease
The background
There is a recent publication: The Effect of Liv.52 DS in Metabolic Dysfunction-Associated Fatty Liver Disease (MAFLD): A Pilot, Randomized, Double-Blind, Placebo-Controlled, Clinical Study
The publication is available via NIH.
The challenge
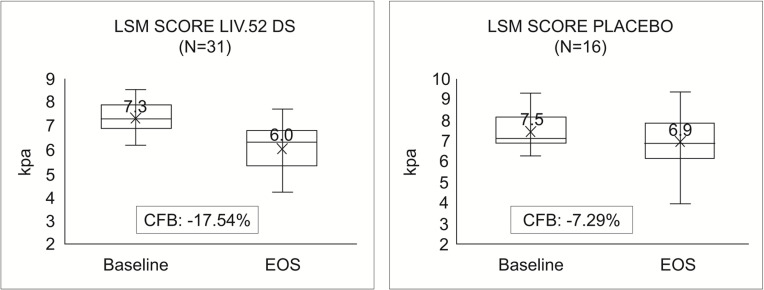
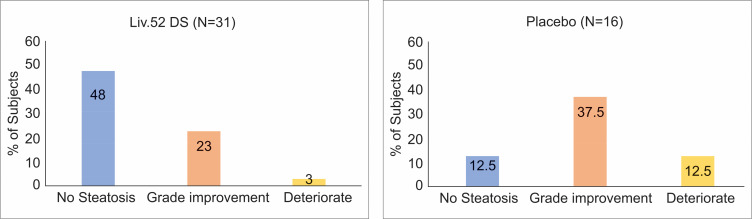
Within the publication the below plots were present. This months challenge is to improve a plot or find a better way to visually present the data.
Mean Change in LSM values (kPa). Comparisons between the groups were performed using unpaired t-tests. Data were collected after six months of randomization.
Comparison of Overall Improvement in Steatosis at the end of study.
The data
The data is derived to match the plotted results in the publication.
| Variable Name | Variable Label |
|---|---|
| Group | Treatment group |
| Baseline_kPa | Baseline value of the LSM Score |
| EOS_kPa | End of study value of the LSM Score |
| Sex | Sex (male/female) |
| Steatosis | Course of steatosis |
| Age | Age at baseline in years |
| Weight | Baseline weight in kg |